A Climate Mural for our Times
Global science, local expression


Norfolk’s rich history and unique landscape are loved by those who live here and are a delight for visitors to discover. Its countryside and coastline are revered for their beauty and biodiversity. Norfolk is also a place where the effects of our changing climate are keenly felt: coastal communities bear the impacts of erosion; our farmland suffers the impact of droughts. In Norwich, the Climatic Research Unit (CRU) at the University of East Anglia has been at the forefront of understanding our climate since it was founded 50 years ago.
Norfolk and Norwich also have a proud and unconventional cultural and social history; of storytelling, of artistic expression, of rebellion and of inclusivity. Norwich is a City of Stories, a City of Sanctuary, and a home for independent thinkers, writers and artists.
Now, as CRU marks its 50th anniversary and world leaders return from COP 27, an exciting collaboration harnesses the powers of art and science to aid our understanding of our changing climate – and makes a rallying call to us all to keep the climate in mind when considering our actions – from politics to the personal.
A Climate Mural for our Times is a 10m-wide work in Norwich City Council’s debating chamber that depicts climate change over 66 million years. Painted by artist Gennadiy Ivanov, its placement is meant as a continuous reminder to our representatives that policy decisions must be made with climate change in mind.
The work is a collaboration between Norwich City Council, CRU, the Transitions Art-Science Project on Climate Change, and Global Water Futures.
Gennadiy Ivanov in the studio, creating one of the panels from A Climate Mural for our Times
Collaboration at the heart of creativity
The painting of the mural was a result of interaction between the artist Gennadiy Ivanov, scientists, Norwich City councillors, representatives of museums, and others. The mural will be the keystone of an evolving art-science community and civic governance project.
Painting the history of Norwich through the lens of our changing climate has been challenging. Our past is woven into changes in our geological fabric and coupled to changes on the global stage; drifting continents, distant volcanoes, changing oceans, one shared atmosphere. Climate science wrote the musical score of the climate stripes, with the beat of the thermal drum always there.
Community leaders wanted to ground the mural in our local human history, and are providing the vision to help shape our voyage to a sustainable future. A vision is nothing if not seen, shared, participated in by those for whom it is created. What matters most is you – and moving you. Wherever the voyage takes us, we are all crew on it.
Join us as we take a deep dive into the stories behind these amazing artworks.

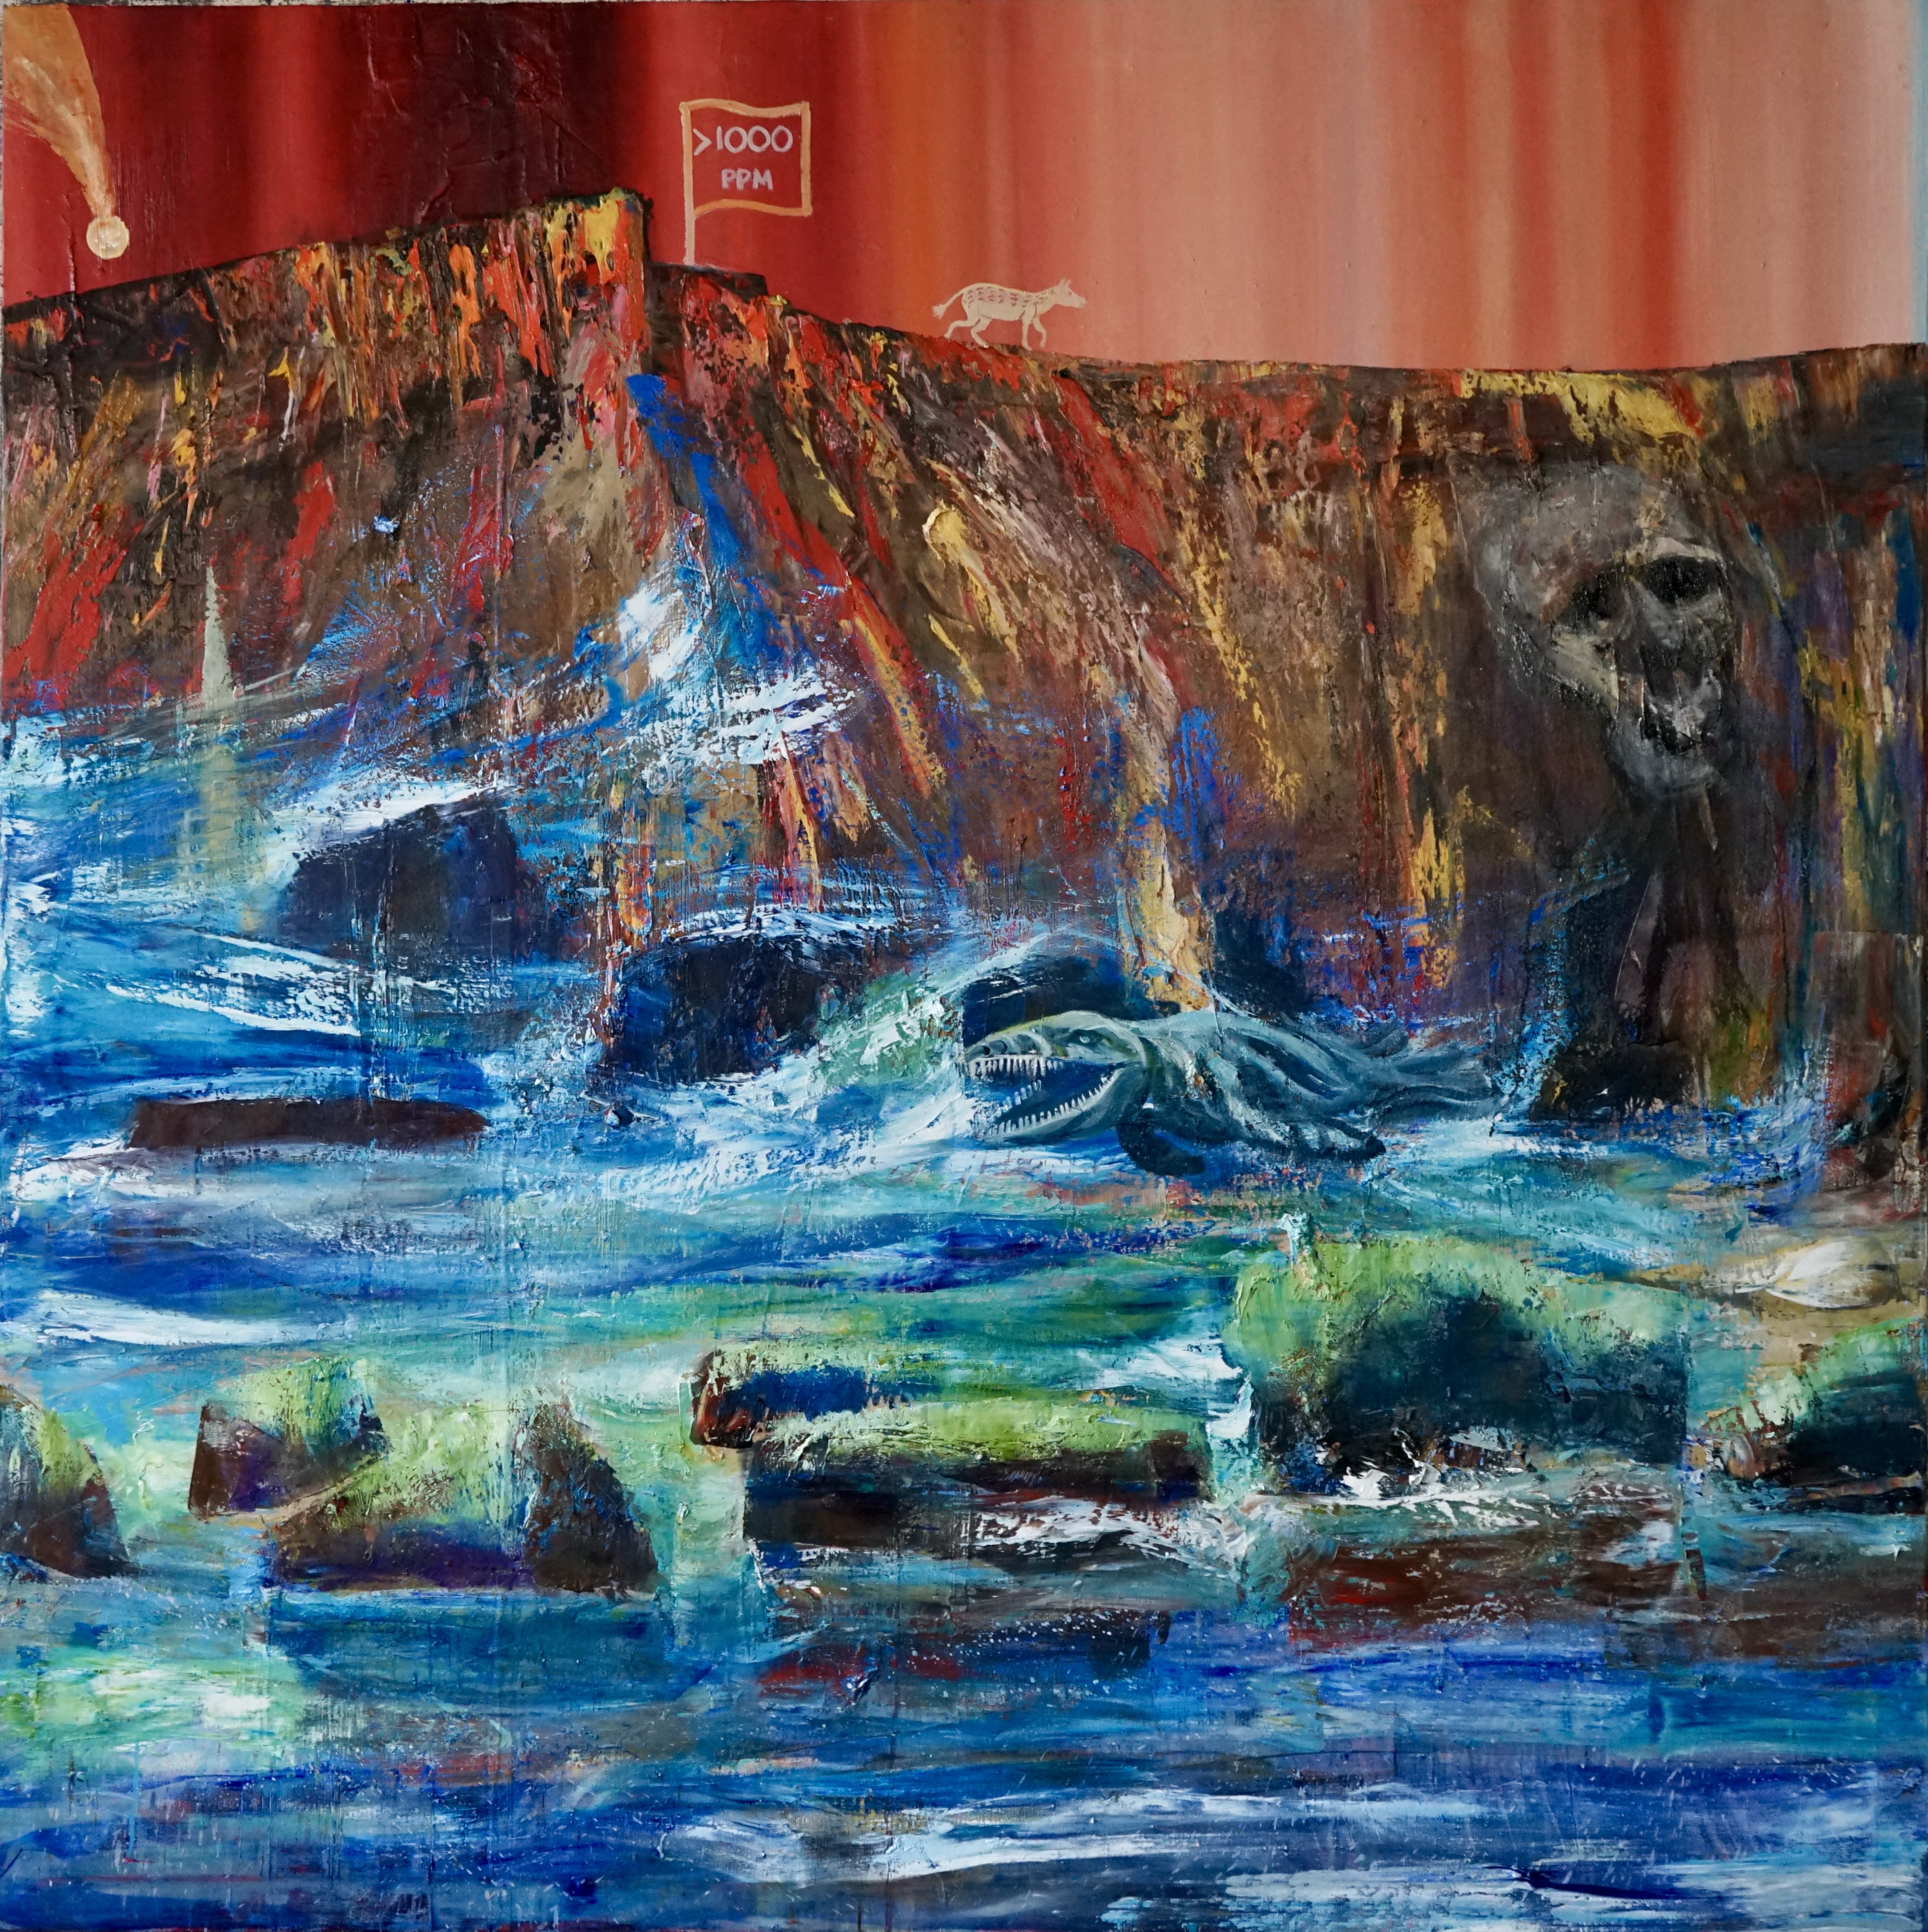


66 million years to 3 million years ago: This panel stretches from the near extinction of the dinosaurs through the age of mammals, when temperatures and concentrations of the major greenhouse gas, carbon dioxide, were much higher than today. The world was free of ice and sea levels were up to 70m higher than today. © Gennadiy Ivanov
66 million years to 3 million years ago: This panel stretches from the near extinction of the dinosaurs through the age of mammals, when temperatures and concentrations of the major greenhouse gas, carbon dioxide, were much higher than today. The world was free of ice and sea levels were up to 70m higher than today. © Gennadiy Ivanov

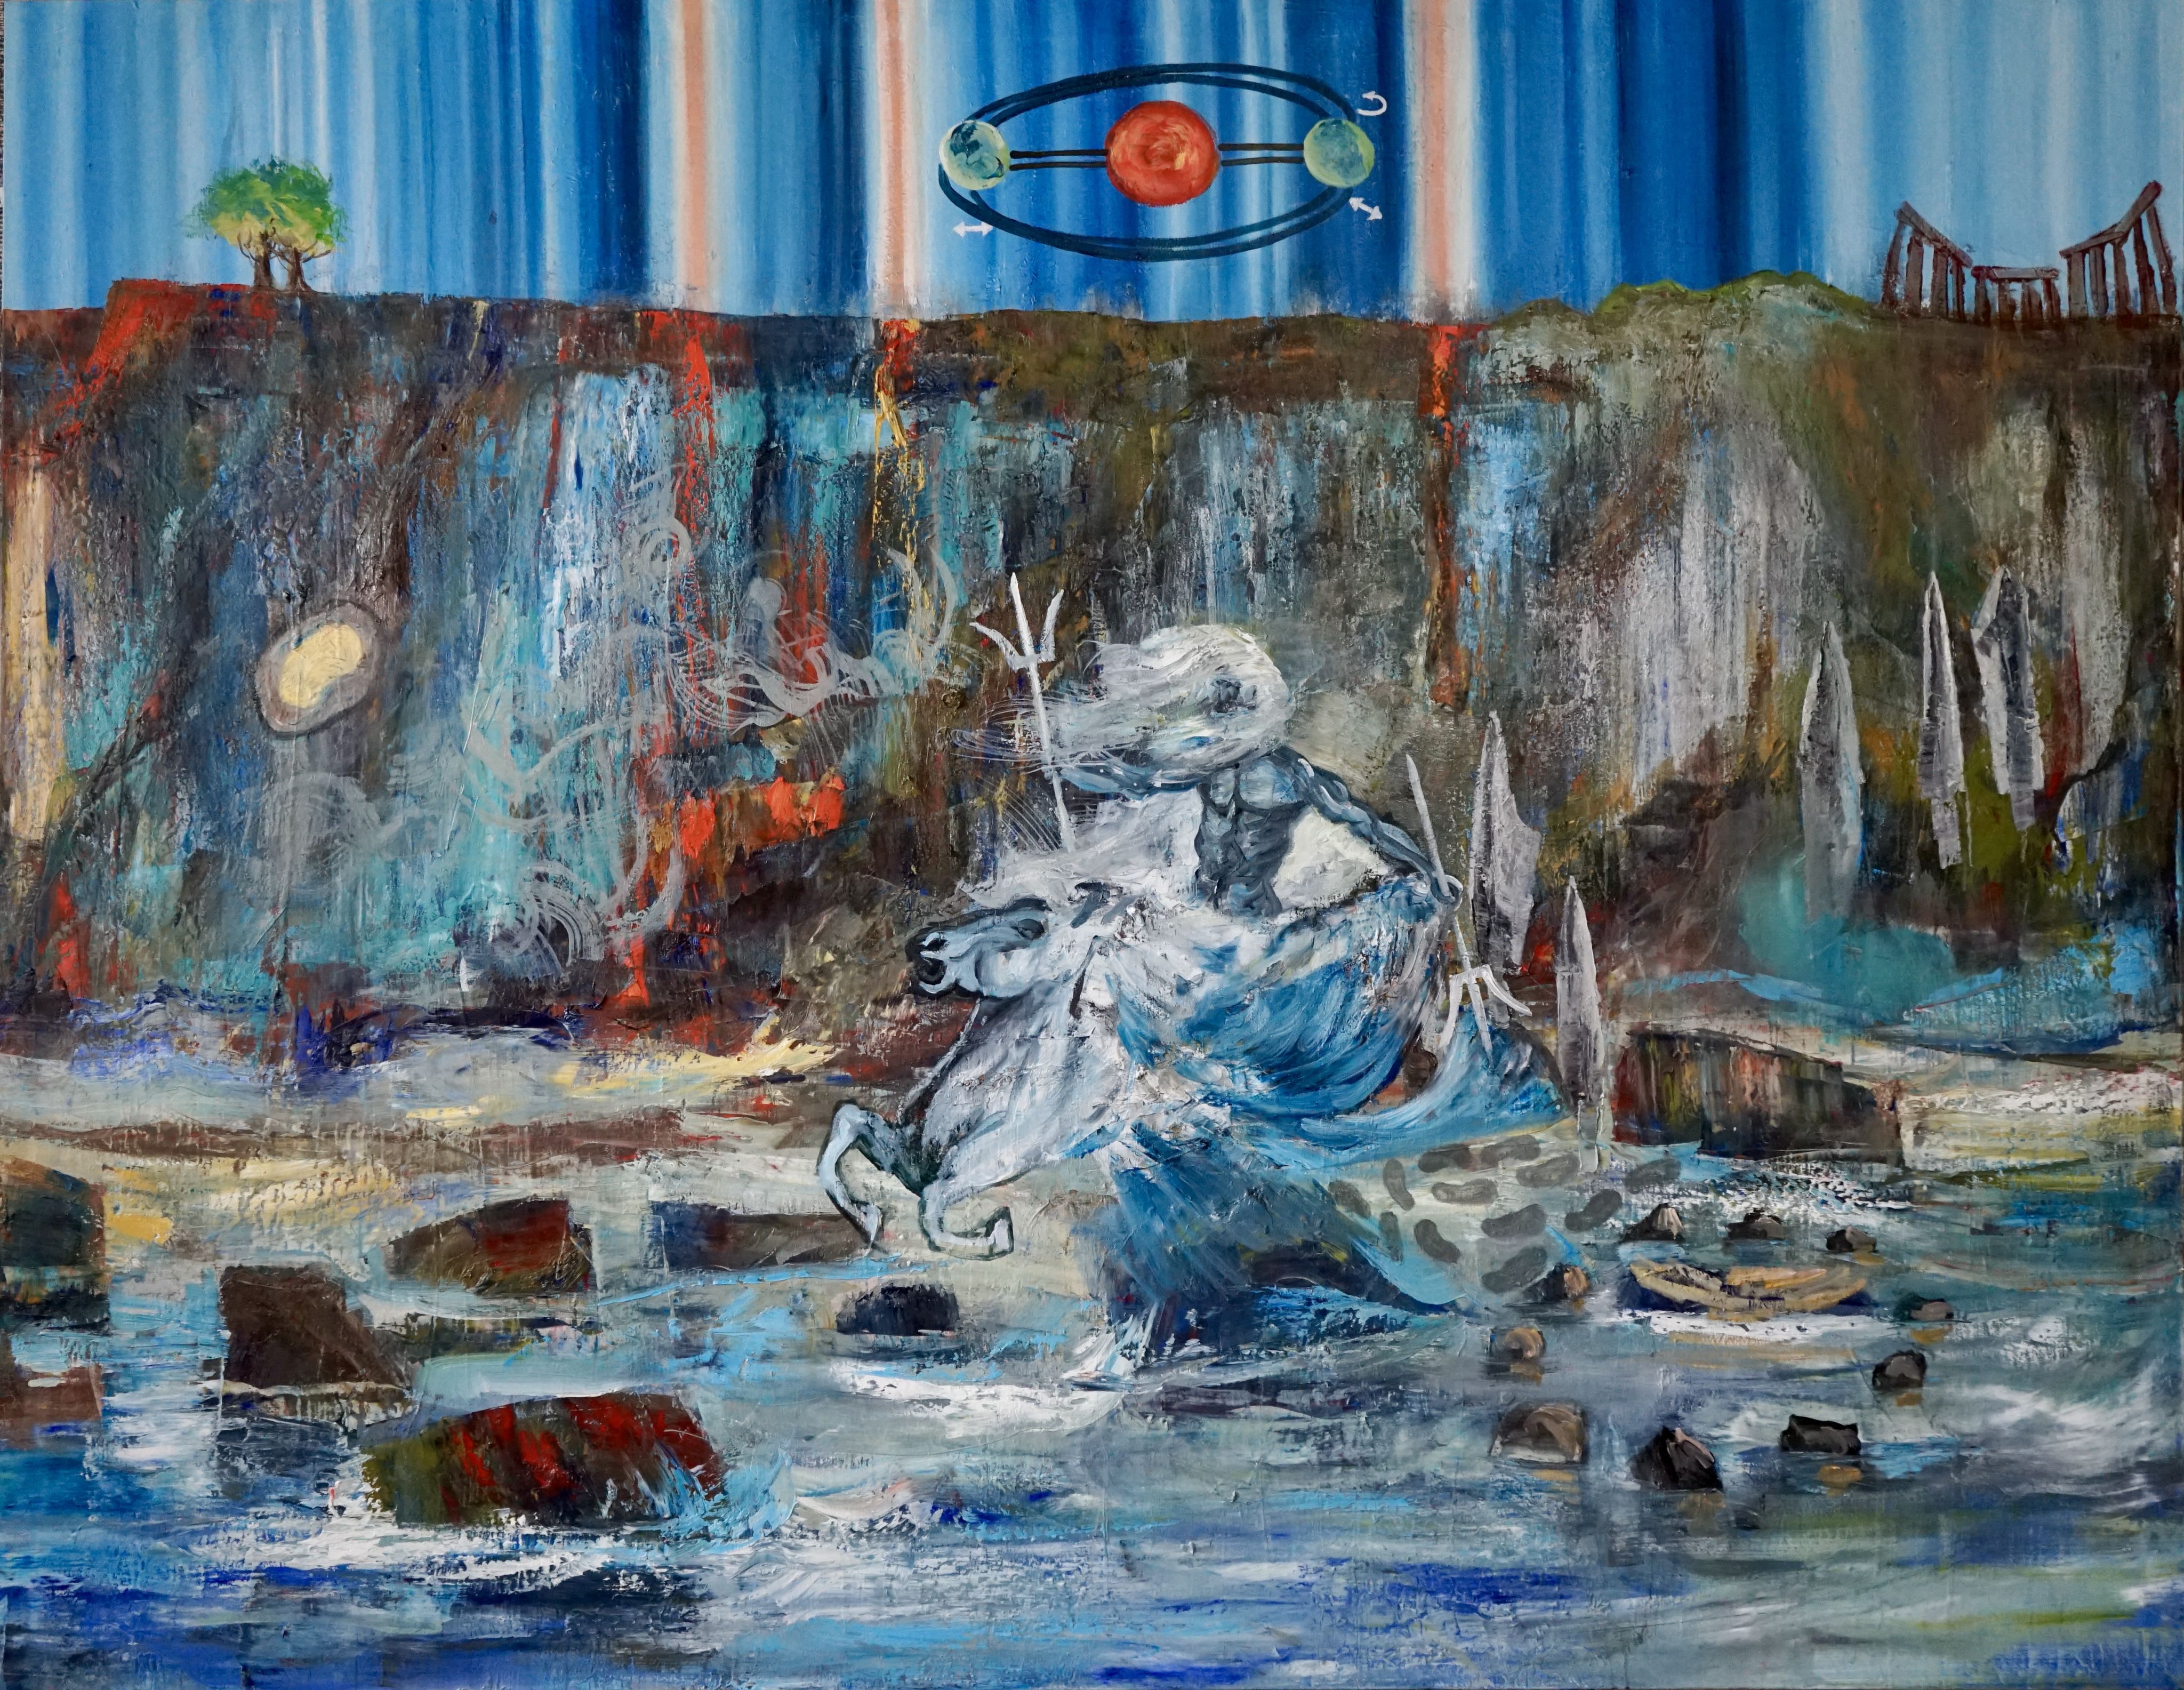
3 million years ago to 500 CE: This period is dominated by the cycle of ice ages. During this time, sea levels fluctuated by about 120m, and Norfolk was touched by ice. The last 12000 years, known as the Holocene, saw a relatively more stable climate, enabling the development of human civilisations. © Gennadiy Ivanov
3 million years ago to 500 CE: This period is dominated by the cycle of ice ages. During this time, sea levels fluctuated by about 120m, and Norfolk was touched by ice. The last 12000 years, known as the Holocene, saw a relatively more stable climate, enabling the development of human civilisations. © Gennadiy Ivanov

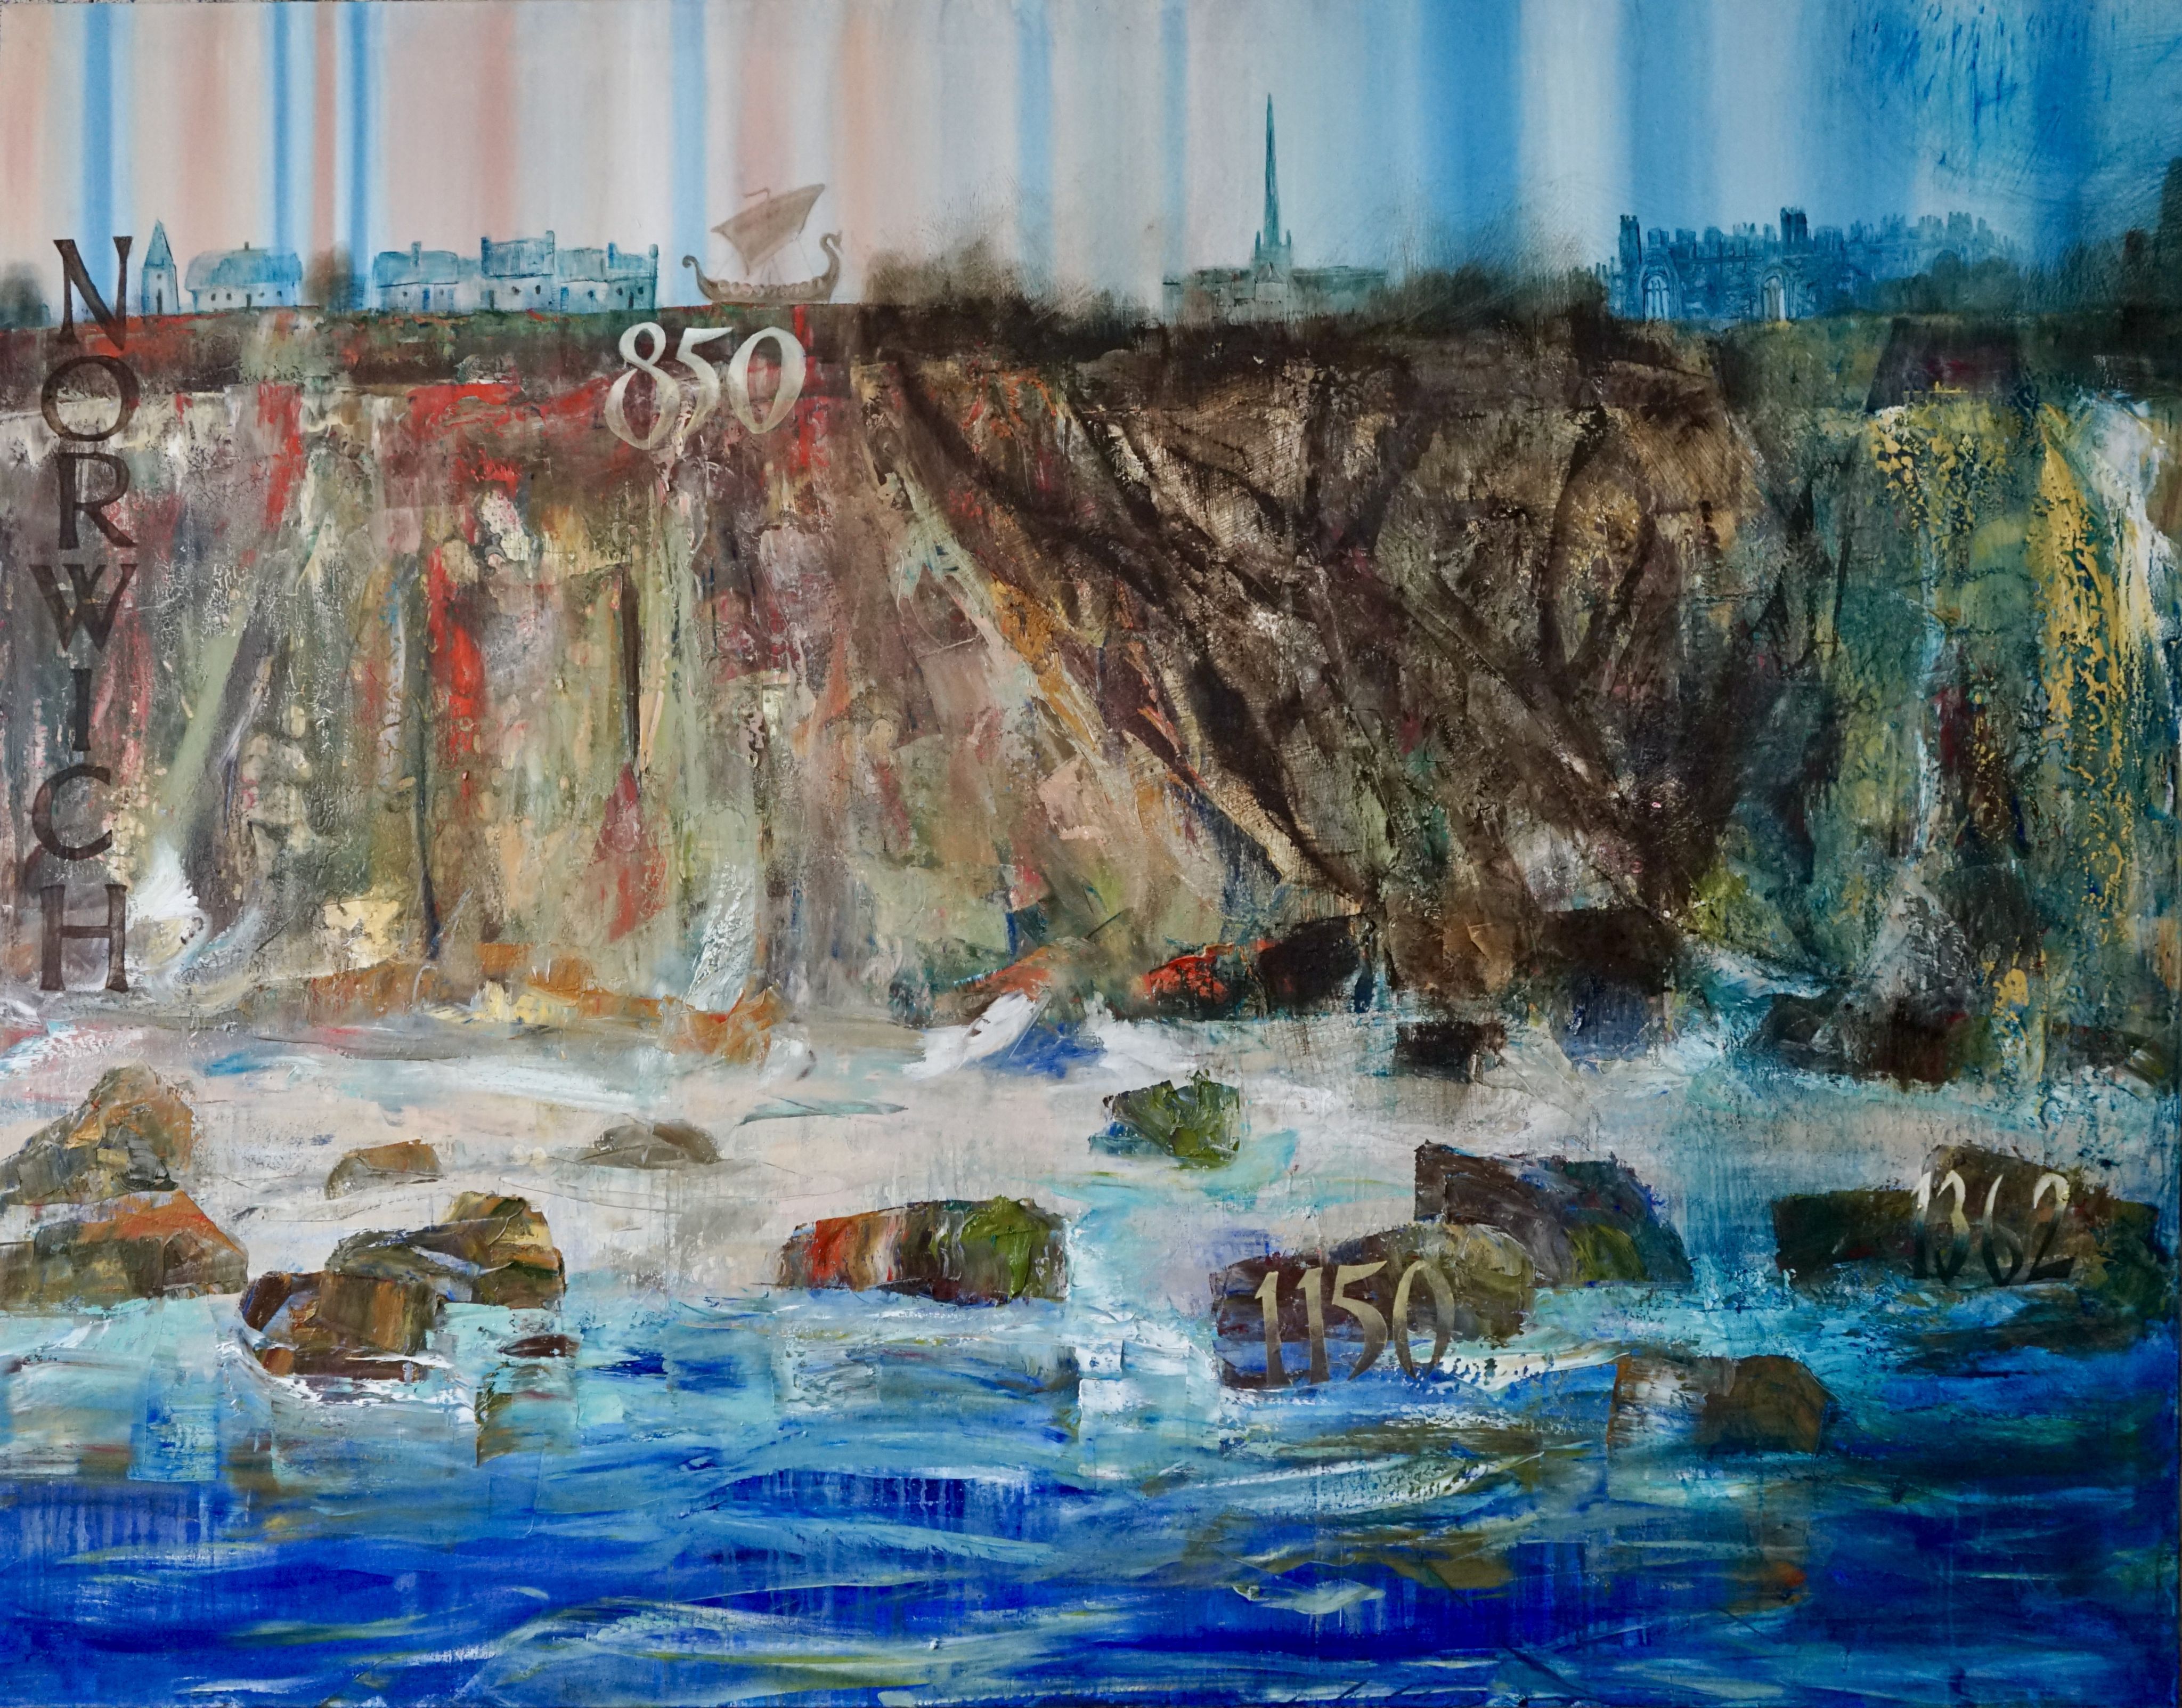
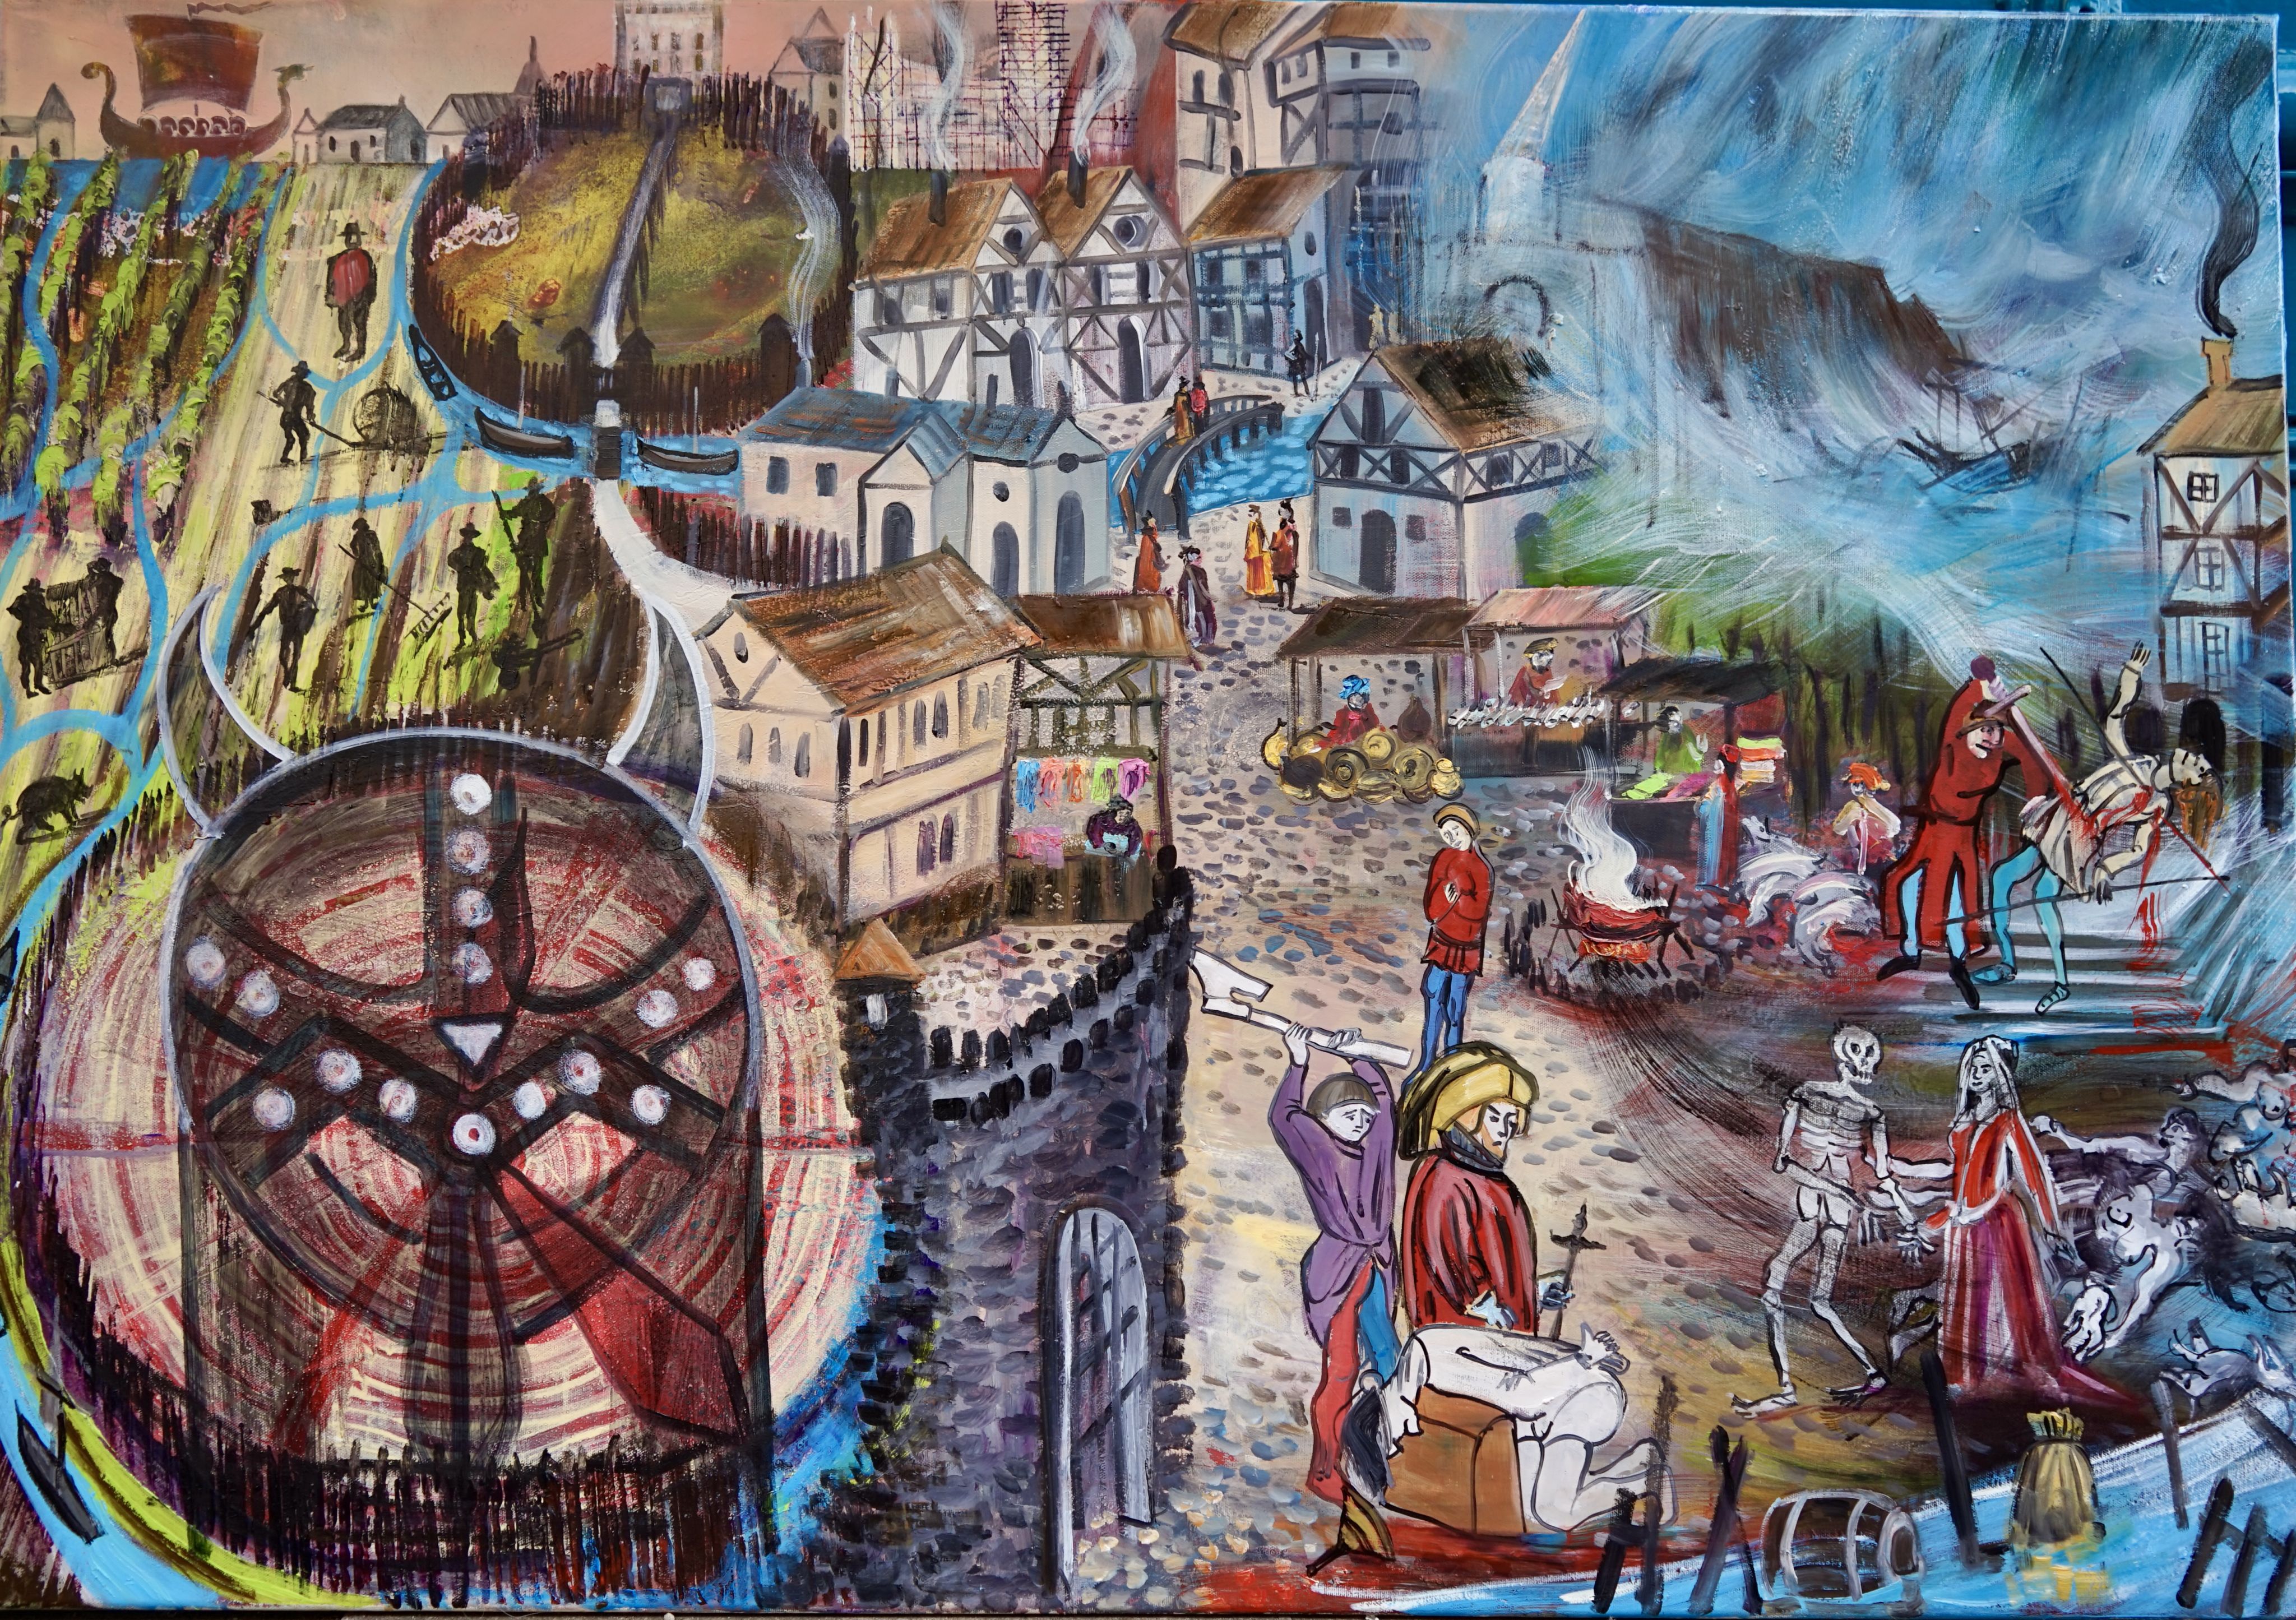
501-1400: Norwich was founded at the beginning of this period, in which the climate was particularly benign. In the 1100s the climate deteriorated, bringing storms, flooding, famine, social unrest, and disease. © Gennadiy Ivanov
501-1400: Norwich was founded at the beginning of this period, in which the climate was particularly benign. In the 1100s the climate deteriorated, bringing storms, flooding, famine, social unrest, and disease. © Gennadiy Ivanov

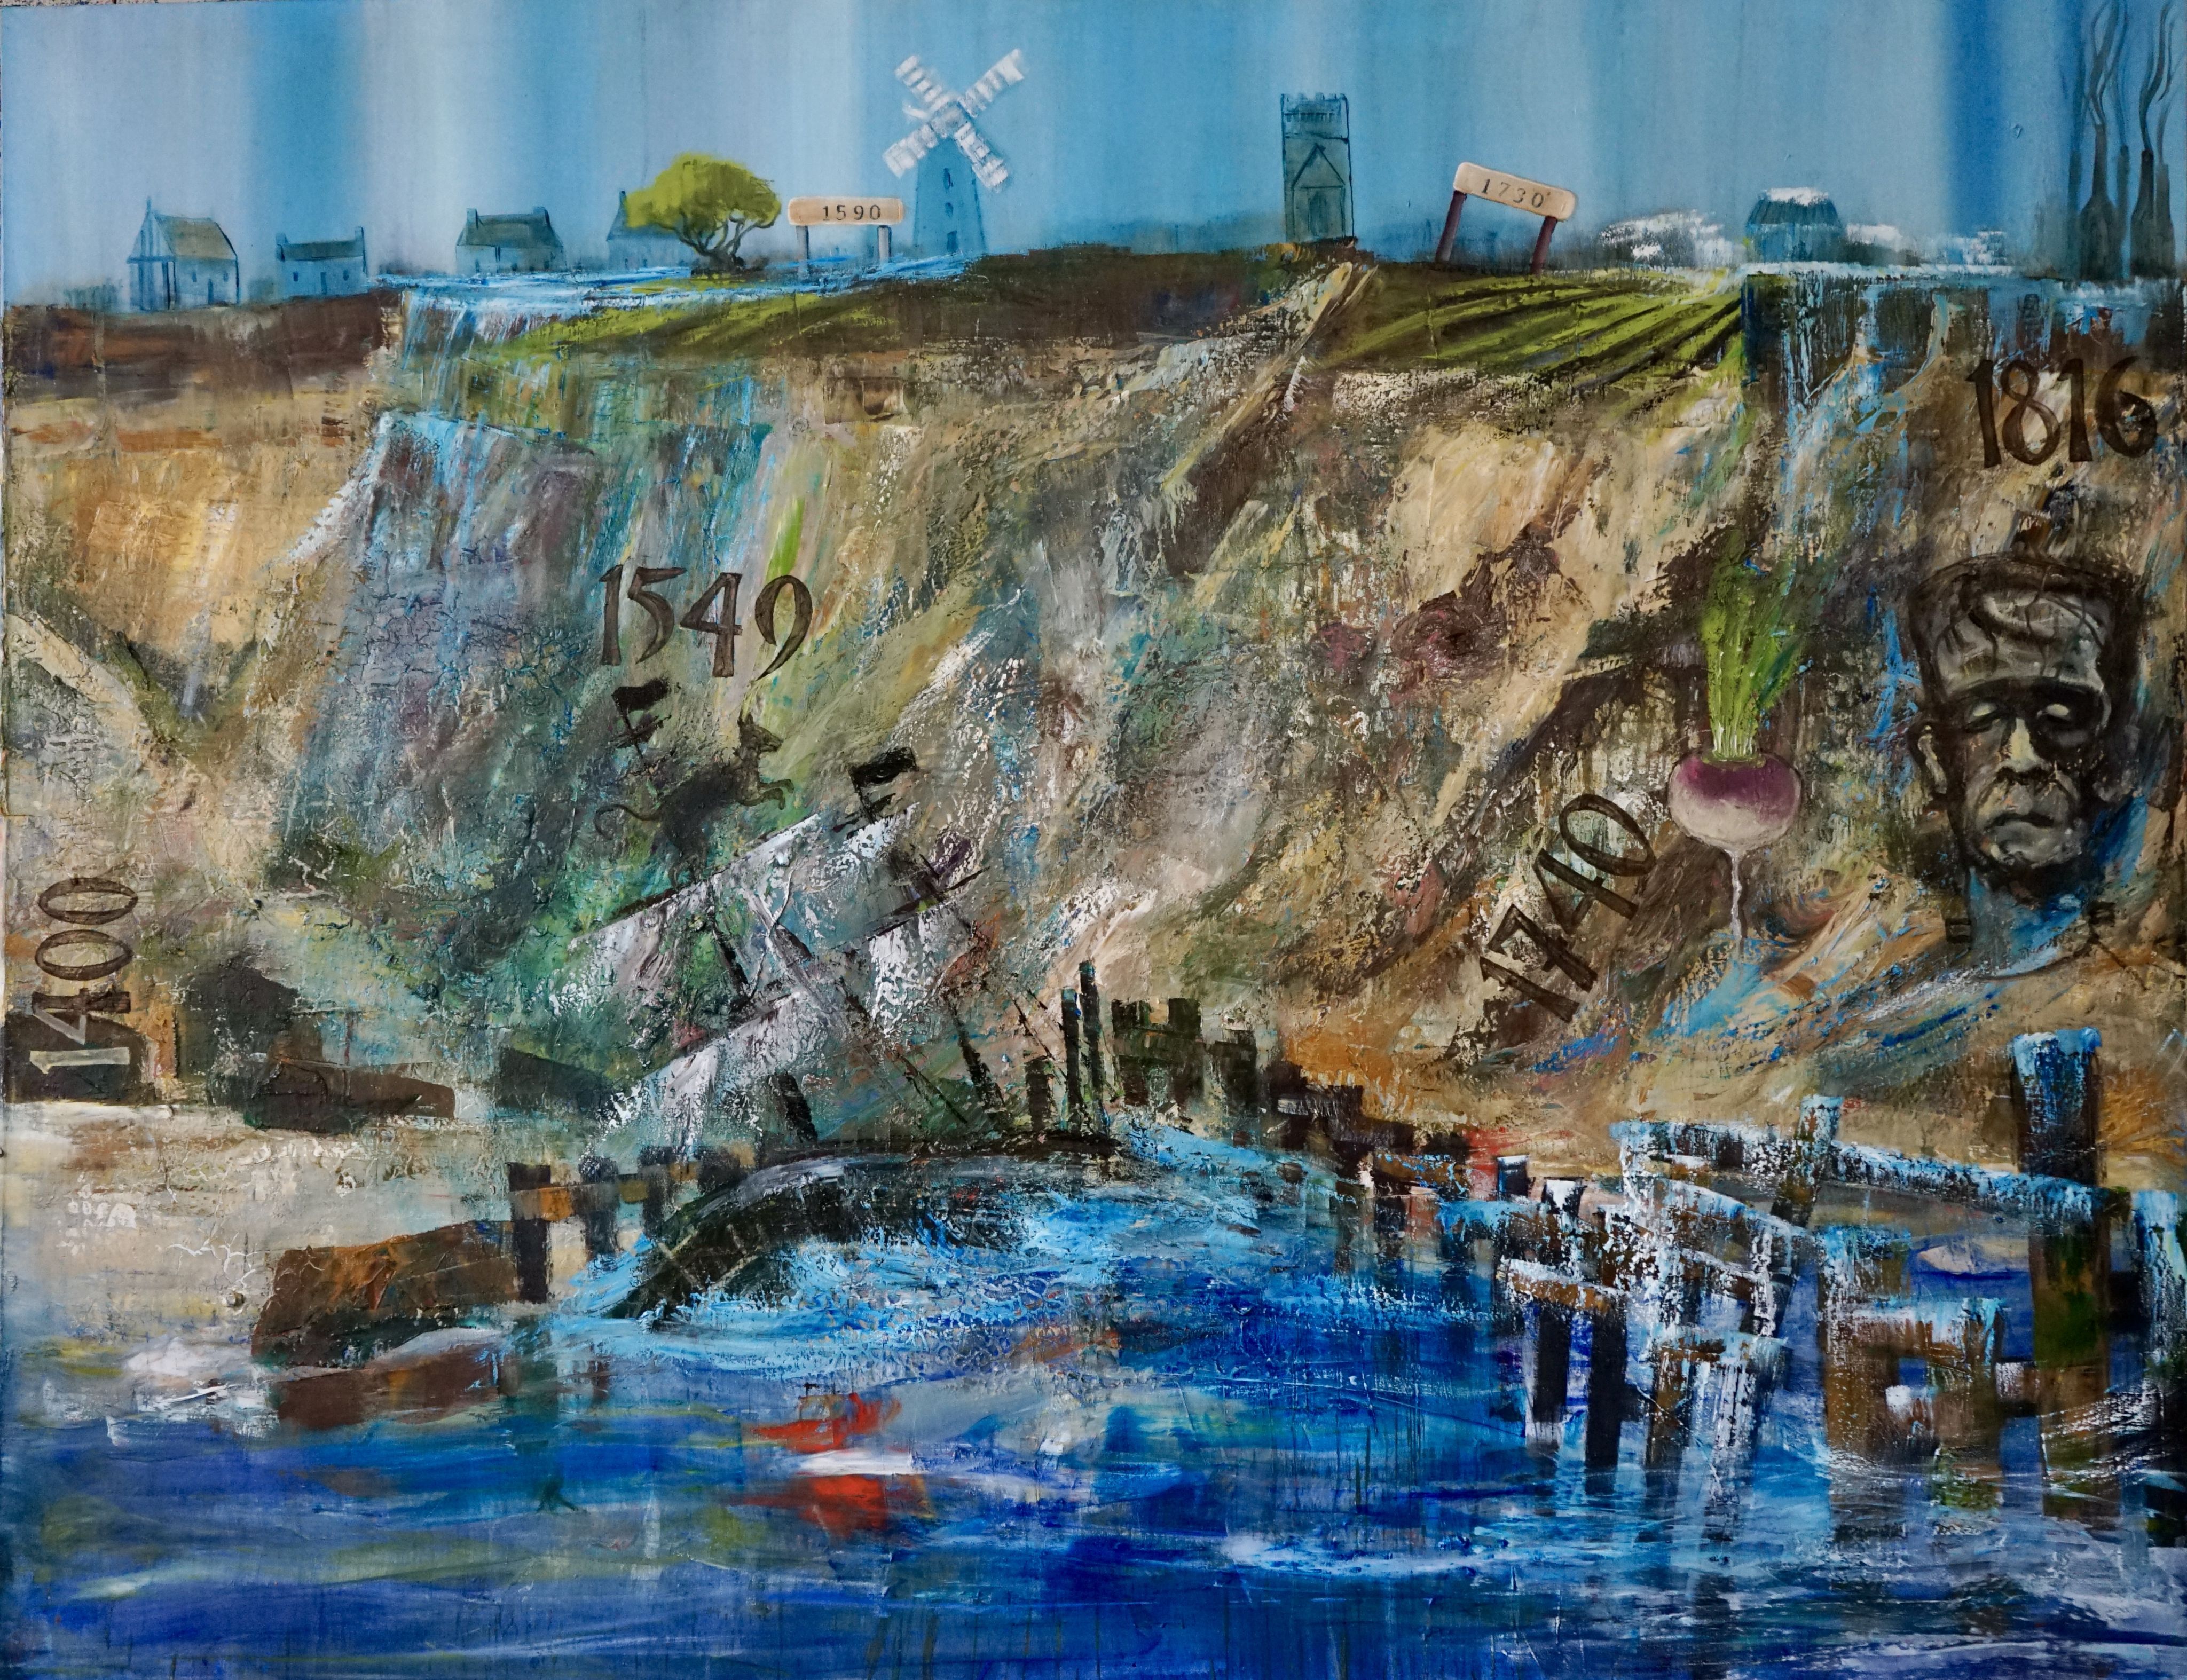
1401-1850: Climate variations in this period had an enormous effect on Norwich and Norfolk, despite being tiny compared with the changes before the start of the Holocene. The so-called “Little Ice Age” saw devastating cold, storms and floods. Although there were severe impacts on society, a revolution in agricultural practices helped counter the deprivations. © Gennadiy Ivanov
1401-1850: Climate variations in this period had an enormous effect on Norwich and Norfolk, despite being tiny compared with the changes before the start of the Holocene. The so-called “Little Ice Age” saw devastating cold, storms and floods. Although there were severe impacts on society, a revolution in agricultural practices helped counter the deprivations. © Gennadiy Ivanov

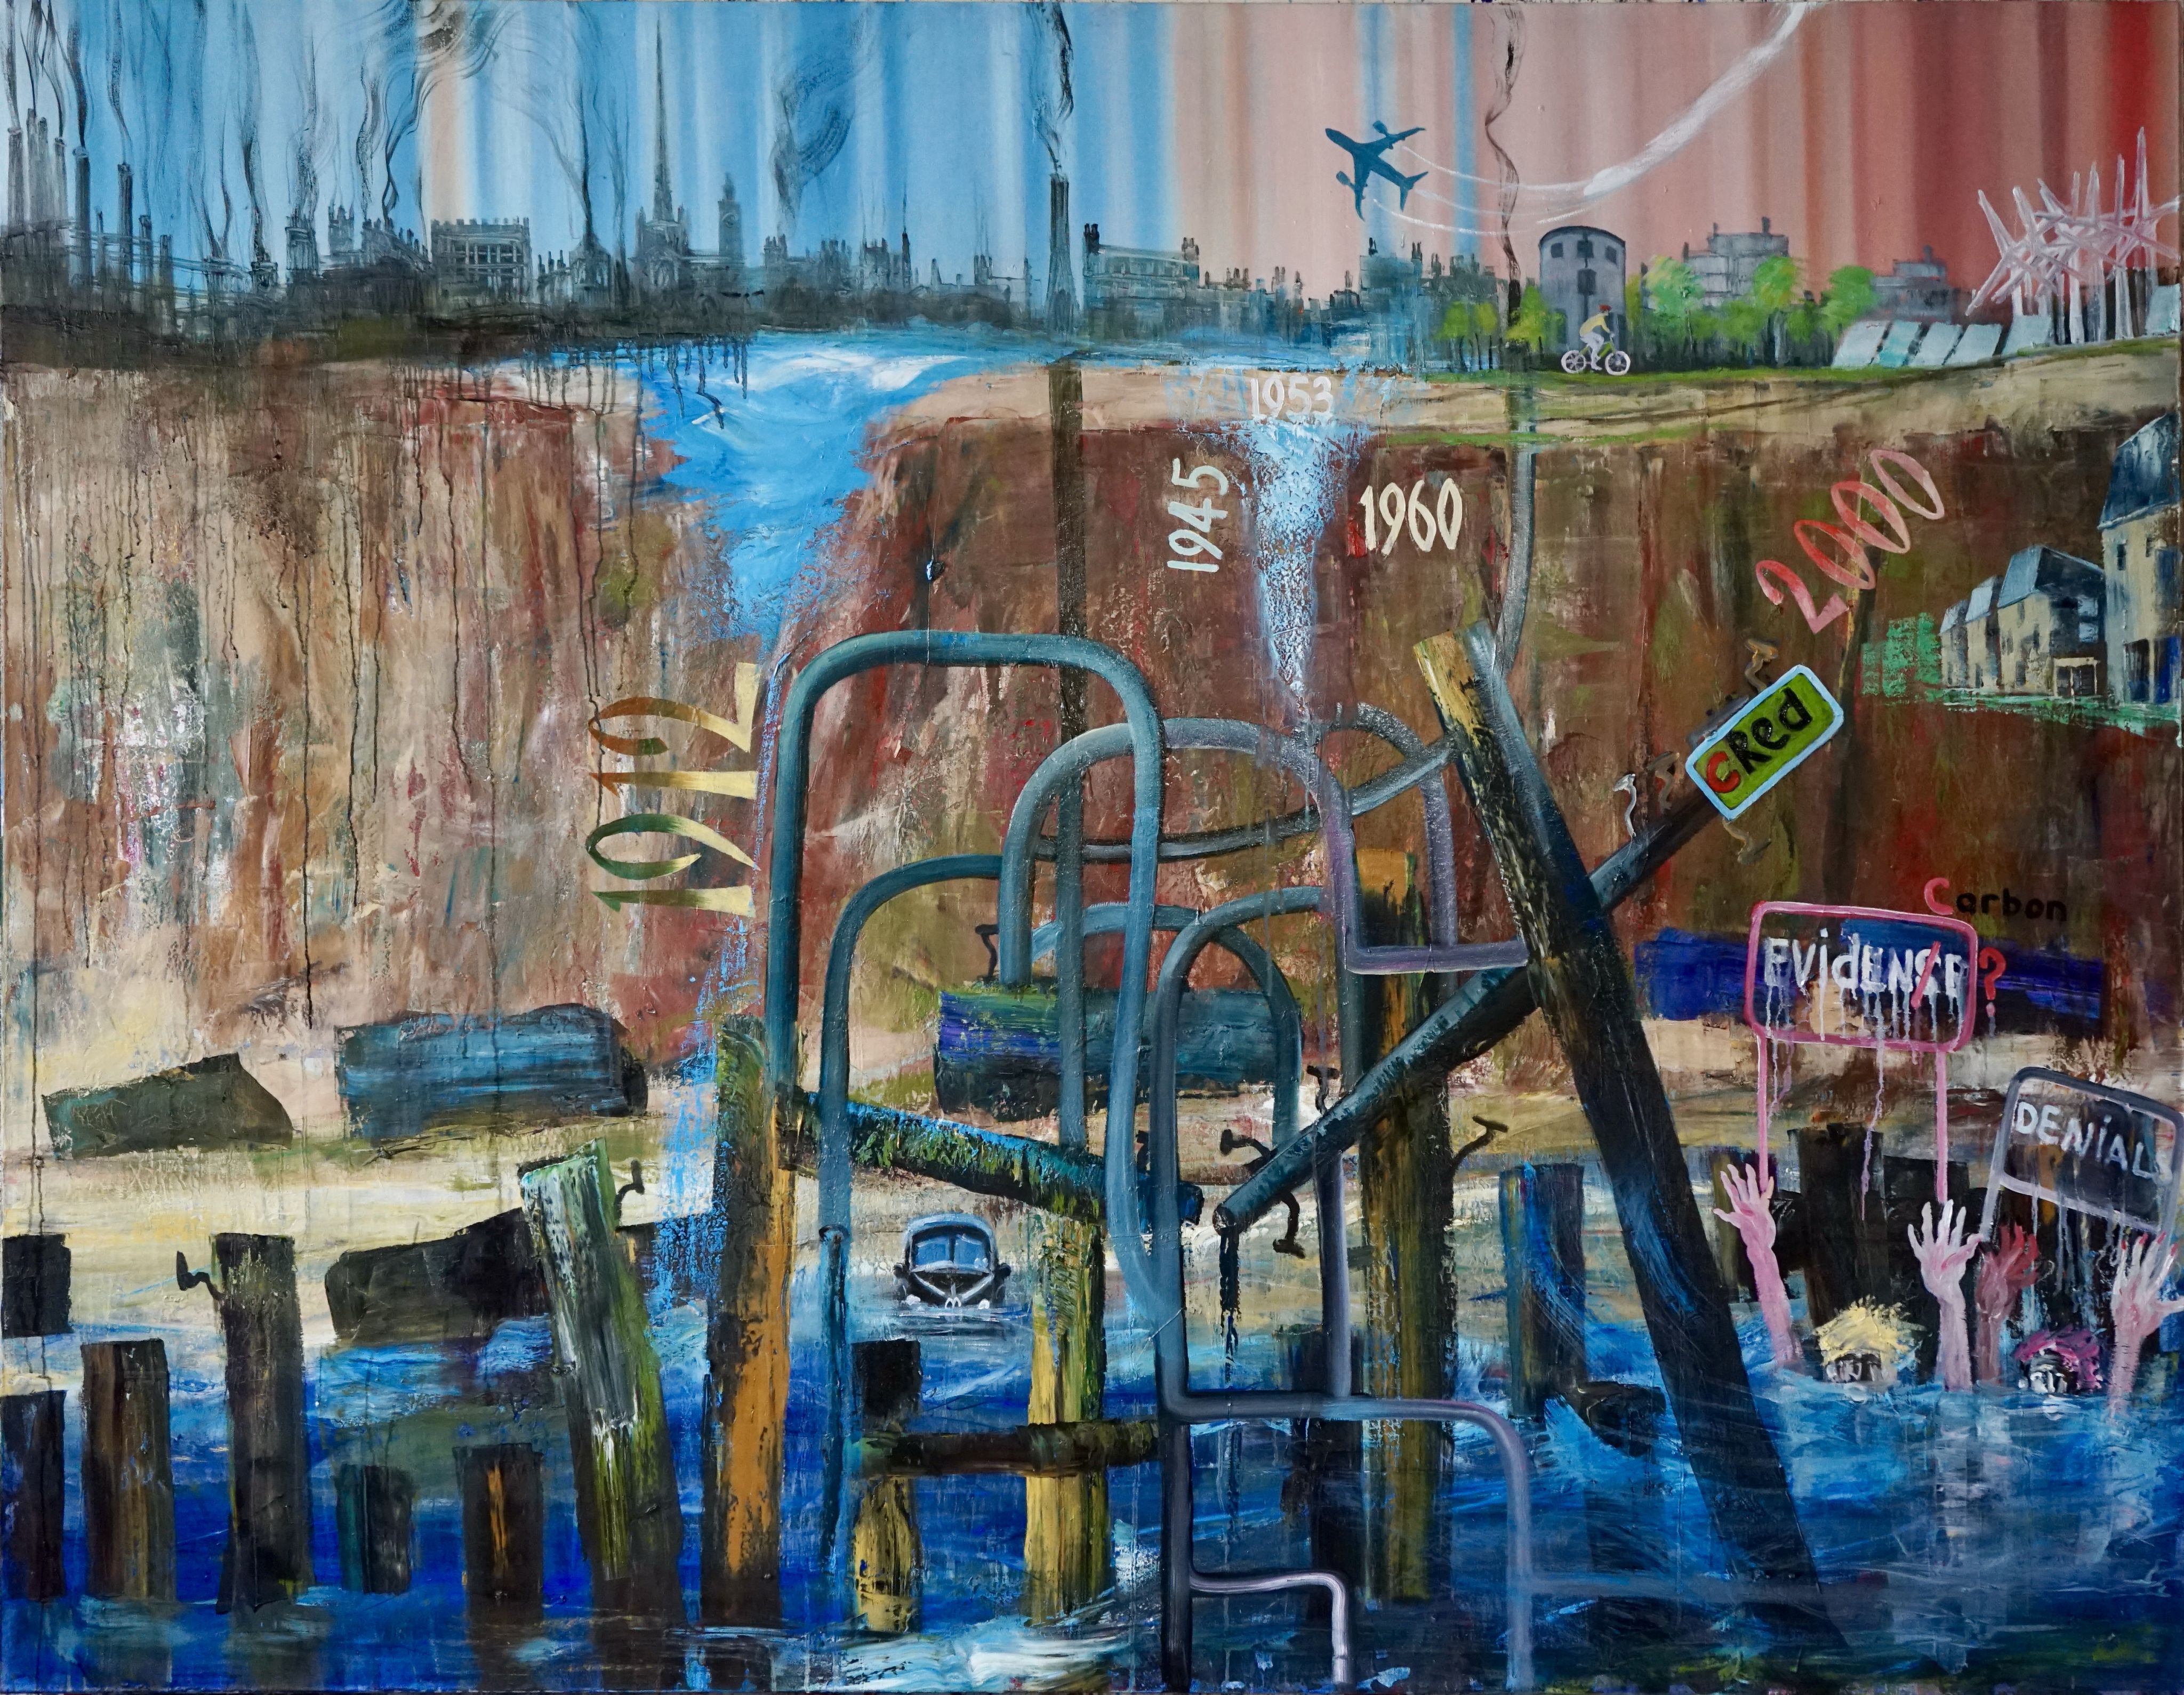
1851-present: This period sees large increases in the emission of the greenhouse gas carbon dioxide (CO2) from the burning of fossil fuel. Temperatures are climbing to levels which have not been seen for thousands of years. Extreme weather events with damaging impacts on human society are becoming more intense. The link between such changes and events and human activity is scientifically established. © Gennadiy Ivanov
1851-present: This period sees large increases in the emission of the greenhouse gas carbon dioxide (CO2) from the burning of fossil fuel. Temperatures are climbing to levels which have not been seen for thousands of years. Extreme weather events with damaging impacts on human society are becoming more intense. The link between such changes and events and human activity is scientifically established. © Gennadiy Ivanov

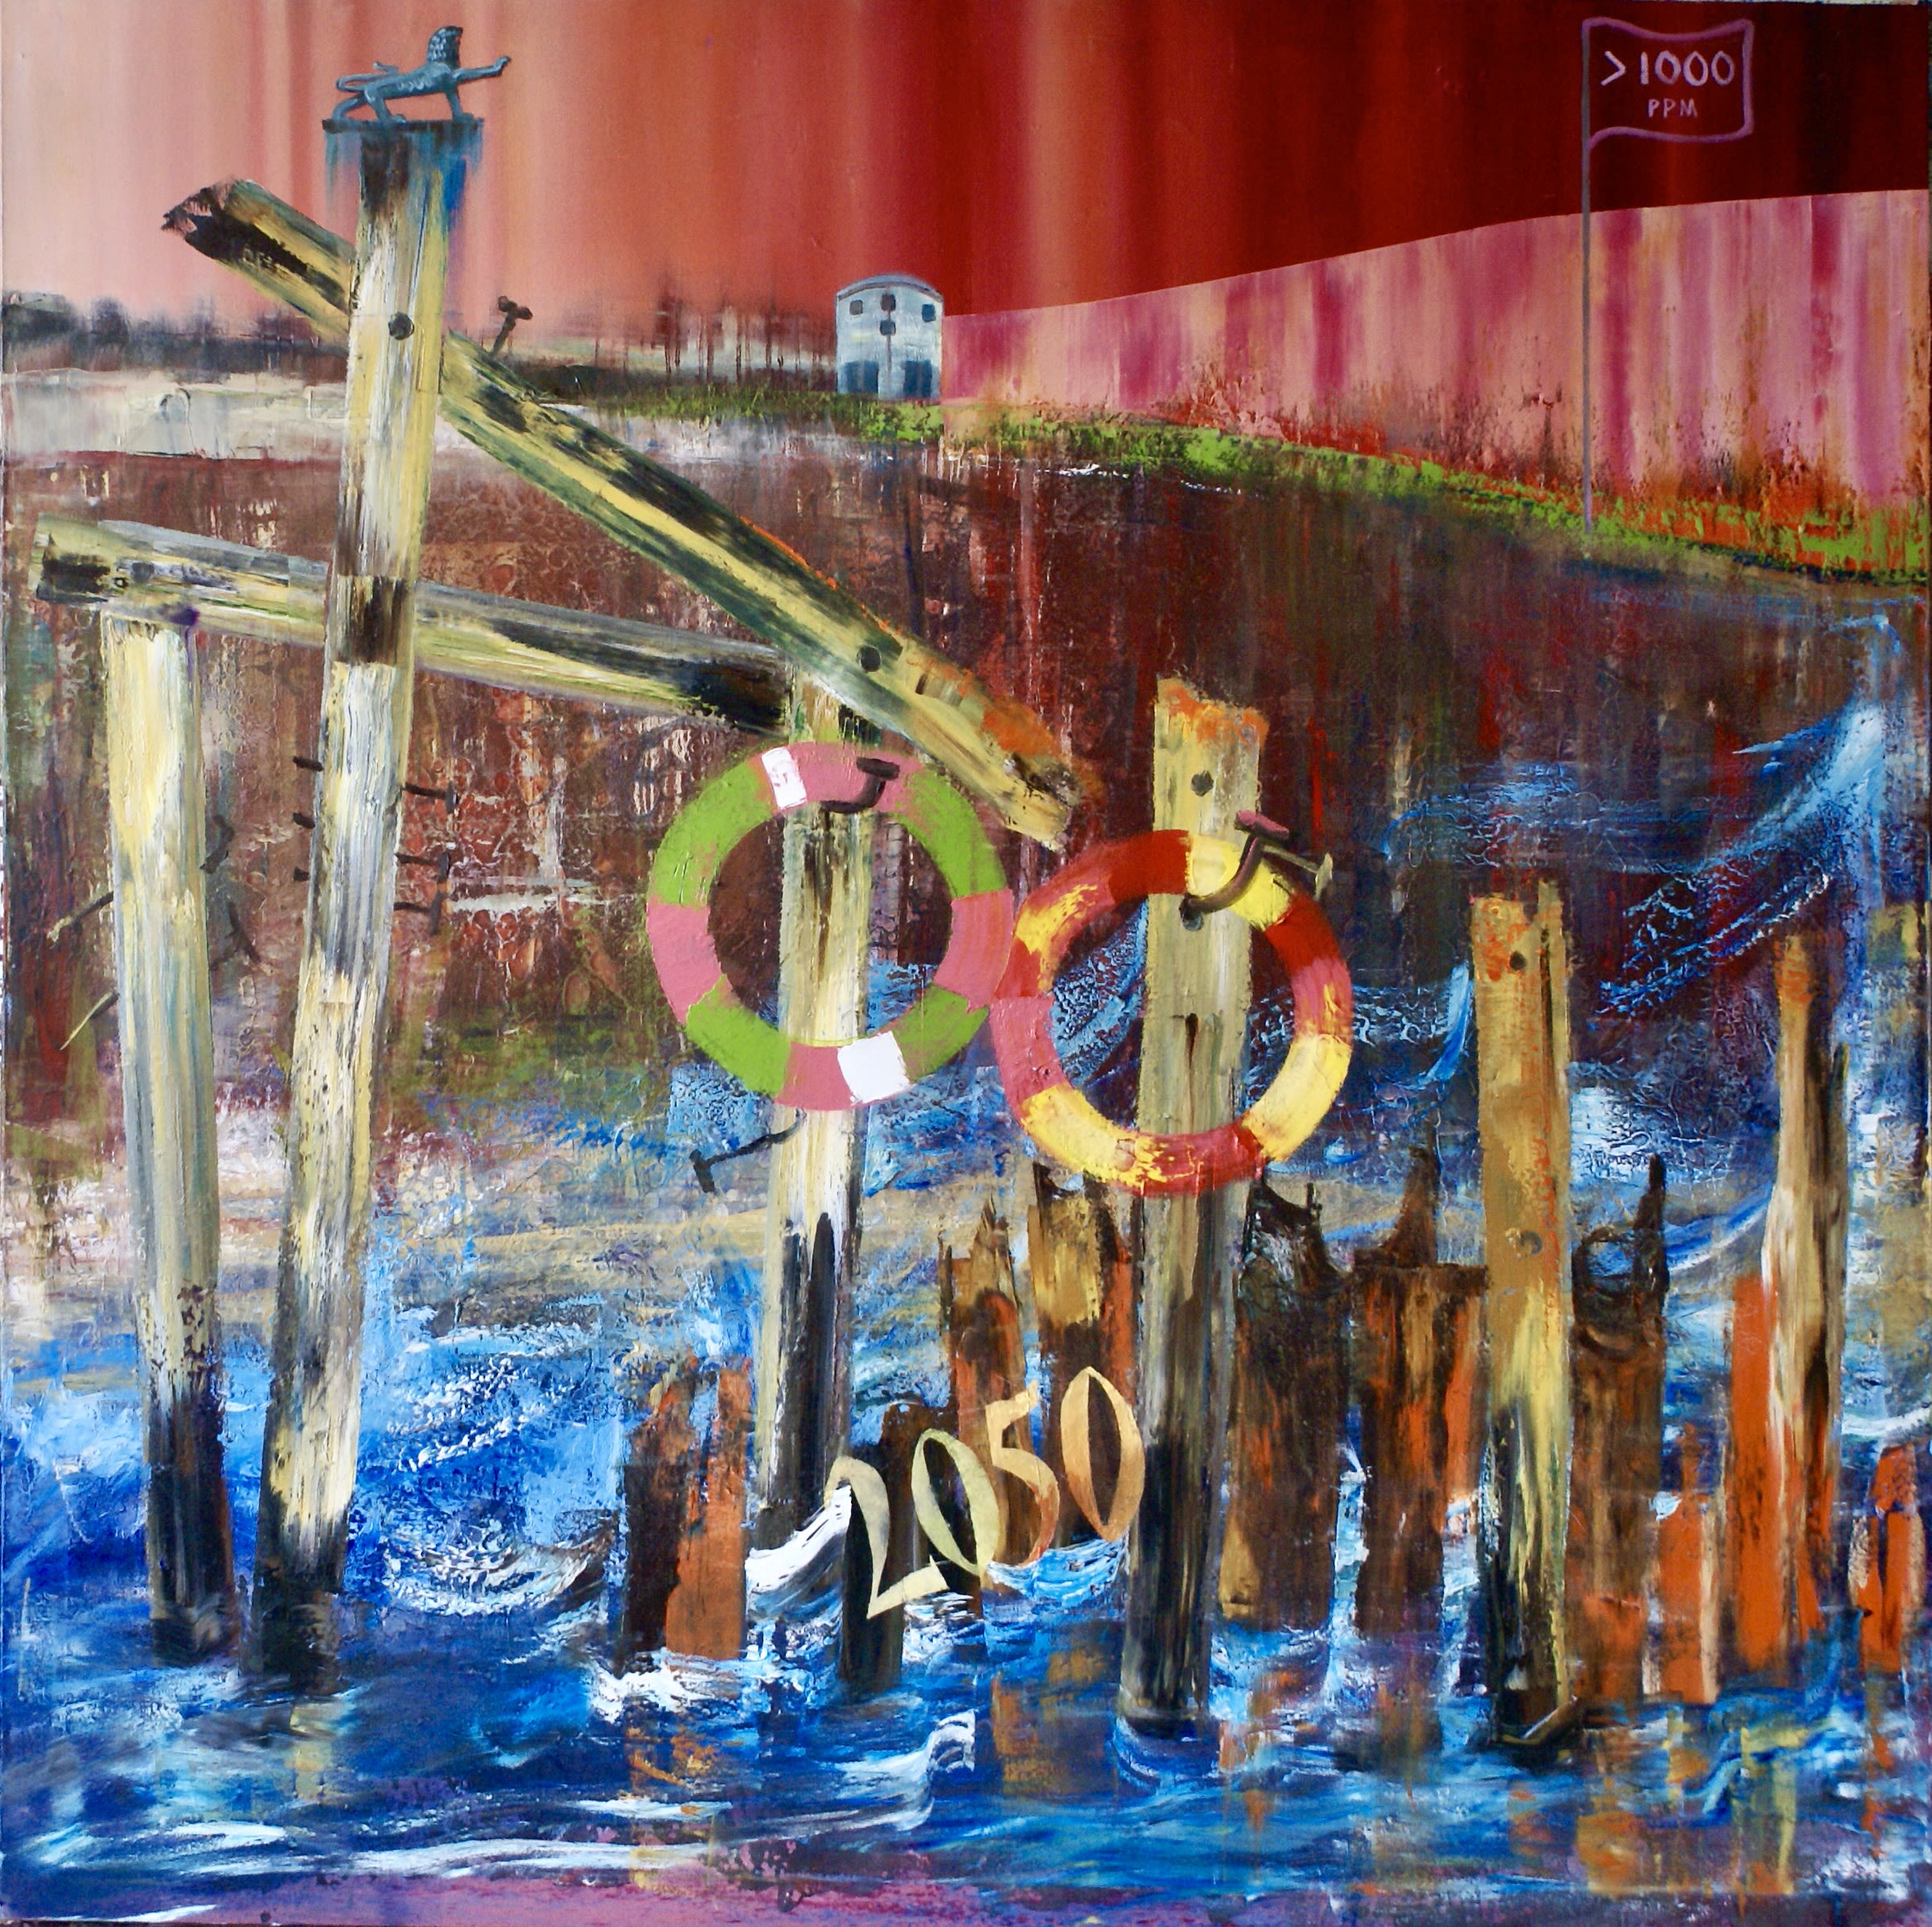
Present-2200: Two possible climate futures are shown here. The first presumes we have taken tough — but possible — action to reduce CO2 emissions to a level where changes in the climate would be broadly manageable. The other future — for which we are currently on course — will lead to CO2 concentrations and temperatures like those seen before the extinction of the dinosaurs. The lifebelts represent these choices. Which one shall we grasp? © Gennadiy Ivanov
Present-2200: Two possible climate futures are shown here. The first presumes we have taken tough — but possible — action to reduce CO2 emissions to a level where changes in the climate would be broadly manageable. The other future — for which we are currently on course — will lead to CO2 concentrations and temperatures like those seen before the extinction of the dinosaurs. The lifebelts represent these choices. Which one shall we grasp? © Gennadiy Ivanov
Norfolk's climate story
The chalk bedrock – the foundation – of Norwich and Norfolk was laid down before the impact of the Chicxulub Asteroid killed most of the dinosaurs 66 million years ago. Temperatures then were much higher than they are today and the world was completely free of ice. Then came the Ice Ages. The ice ground and scoured the bedrock, once burying Norfolk, and deposited glacial debris. The ice gave us much of the landscape we see today.
Our ancestors in Norfolk knew the ice. The earliest human footsteps outside Africa were found on Norfolk’s shores. Their descendants made the first tools, from flints, which formed in the underlying ancient chalk bedrock. They hunted, and outlasted, the woolly mammoth. Once the ice retreated, the slow, grinding forces of nature continued and our coastline was shaped by the relentless power of the sea.

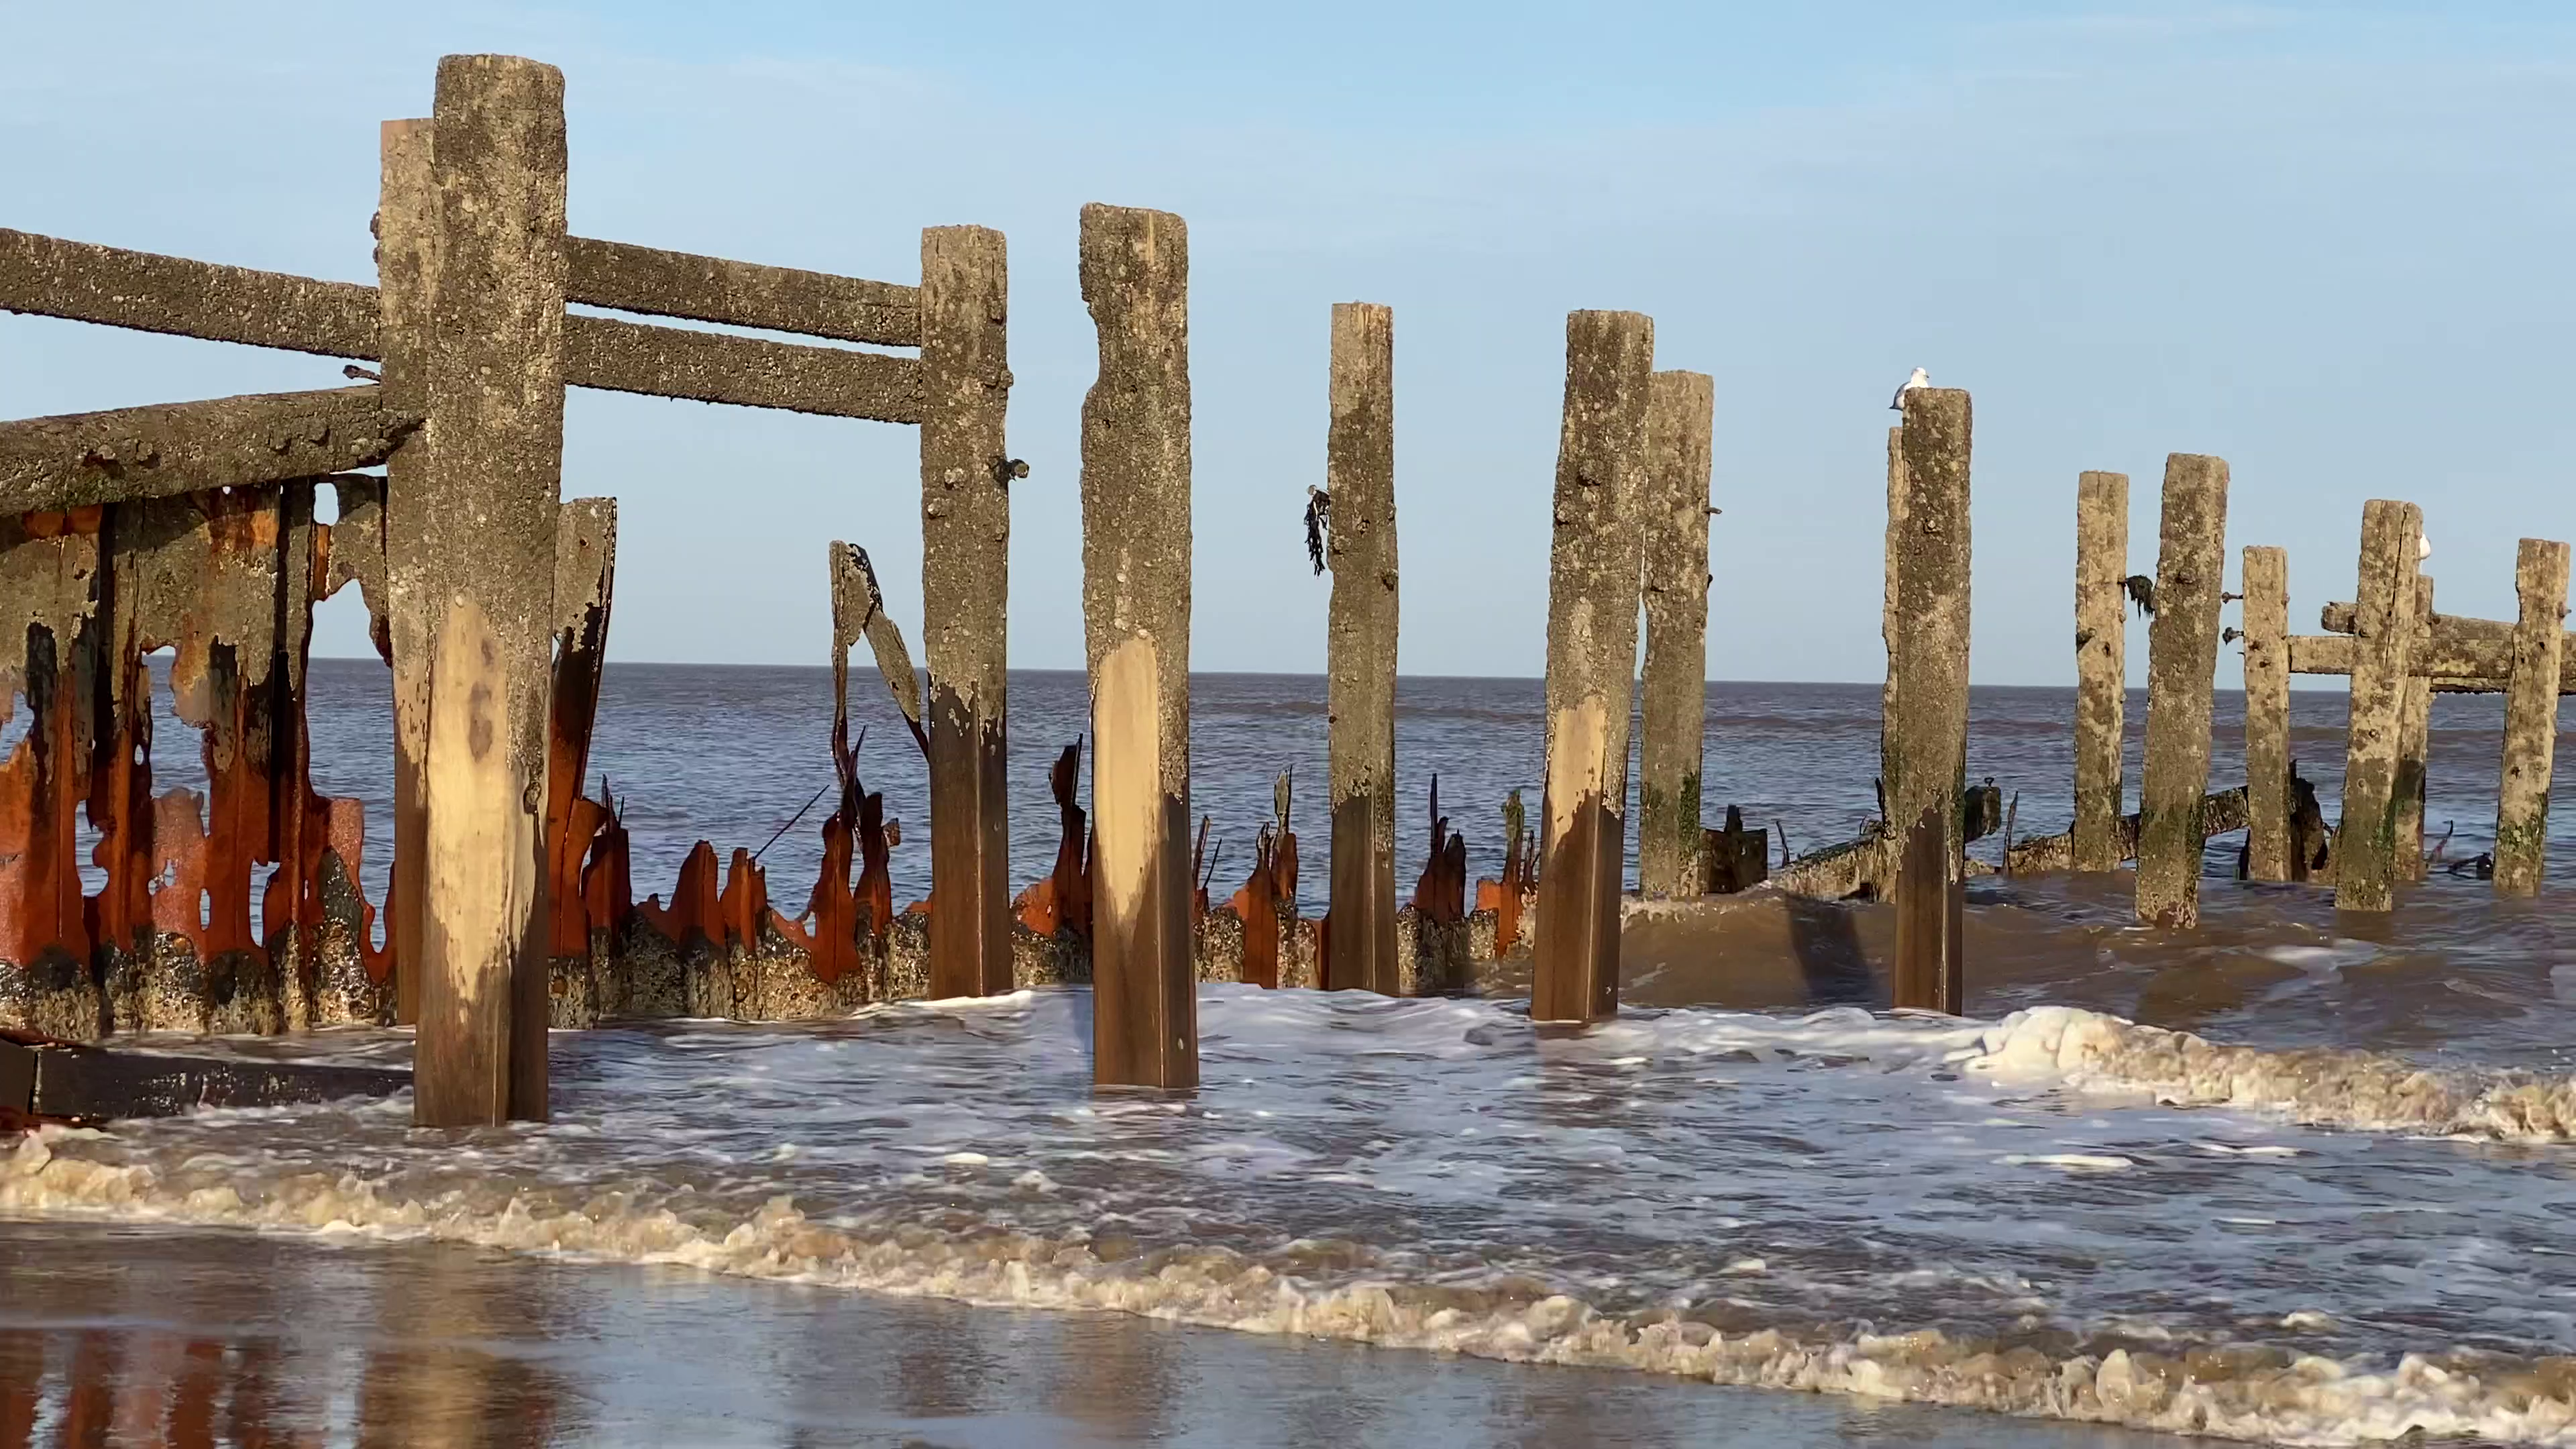
The Norfolk cost, shaped by millions of years of climate changes Image Credit: Gennadiy Ivanov
The Norfolk cost, shaped by millions of years of climate changes Image Credit: Gennadiy Ivanov
The world got warmer, but nowhere near as warm as before the Ice Ages. A short period of relative climate calm called the Holocene, lasting 12,000 years, provided some stability for 400 generations of humans. But even during this period of relative calm – a short flat line of temperature compared to the immense changes seen over previous millions of years – there were climate changes. These changes were inconsequential on the geological scale, but they produced conditions which were powerful stressors for people and amplified other burdens. Tumult, rebellion, witch-hunting, and mass migrations were the result. Norfolk and, from its founding around 500 CE, Norwich witnessed these impacts.
Where are we now?
The world is moving out of this period of relatively constant temperatures.
We have entered the Anthropocene, where our climate is determined by humanity’s actions. Global temperatures are now higher than they have been for thousands of years and are increasing faster than they have for at least 2000 years. The 2022 Global Carbon Budget, produced in part by UEA, shows that emissions show no sign of the decrease that is urgently needed to limit the world’s warming to 1.5oC.
The major reason for the rate of change is the burning of fossil fuel. Burning fossil fuel releases carbon, laid down in the Earth hundreds of millions of years ago, back into the atmosphere as carbon dioxide. In the next 200 years, we are on course to emit most of the carbon in extractable fossil fuel reserves back into the atmosphere. If this happens, temperatures would climb back towards those experienced by the dinosaurs in just a few centuries.
We are wrapping our planet in a blanket of carbon dioxide. We are overheating. The icecaps and glaciers are melting as we move towards an ice-free world again. Sea levels are rising. Our coast is crumbling. Lands are becoming parched. Our wildlife is being lost. We have set course to return to climates perhaps 6 degrees warmer than before the Industrial Revolution.
We still have choices. Shall we act as guardians of the Earth for future generations? Or shall we leave those future generations to pay the consequences of us doing too little?
Bringing art and science together
Our climate history is a rich and powerful story, explained by ground-breaking research. The human story is also rich, punctuated by innovation, achievement, triumphs, mistakes, despair, and destruction. These stories are intertwined, and we need a way of communicating and recording that richness.
Our ancestors survived predators, ice, fire, famine and flood. They even survived themselves. They told the stories of their survival and their innovations through paintings, song, dance, and drama.
Art can encapsulate, project, and communicate rich stories. It can inform and inspire. It can provoke. It can pose questions in the mind of the viewer. It can uncage the mind.
If we are to avoid the very worst consequences of climate change, we need to break out of the cages of denial, avoidance, or despair. We need to be reminded, and led, by those young people who understand and who demand mobilisation of effort. They can see the opportunities in rising to the challenge.
Norwich has a history as, and a reputation for being, a revolutionary city. We go back to history in bringing together art, science and civic governance to tell the combined story of climate and society. With A Climate Mural for our Times, we also foretell possible outcomes – dependent on current and future decisions – and place them at the centre of civic governance. Norwich has been a cradle for art and global climate science. It could be a cradle for changing mindsets.
The elements paintings
Each of the five elements paintings complements a panel of the mural, depicting social and natural events related to or influenced by the clamitic changes seen in the panels. Explore them below.
Our climate origins: 66-3 million years ago


Born Dippy: In this first elements painting, Dippy the dinosaur looks on as our time on Earth ends in a bus crash © Gennadiy Ivanov
Born Dippy: In this first elements painting, Dippy the dinosaur looks on as our time on Earth ends in a bus crash © Gennadiy Ivanov
This painting portrays the links between the climates and geology of the periods even before the time of the start of the mural and today’s Norfolk and Norwich. They include the character of the internationally important chalk rivers of the County, including the Wensum. No dinosaur fossils have been found in Norfolk, but Dippy visited Norwich in 2021.
From his standpoint of time before the collision of the asteroid which wiped out most of his relatives, he is pondering our possible fate. He sees our much shorter time on Earth as ending in a bus crash (dinosaurs think big). A famous consequence of Norwich being built on chalk bedrock was the double-decker bus being partially swallowed by a local chalk sinkhole – pictures of which went around the world.
3 million years ago–500CE

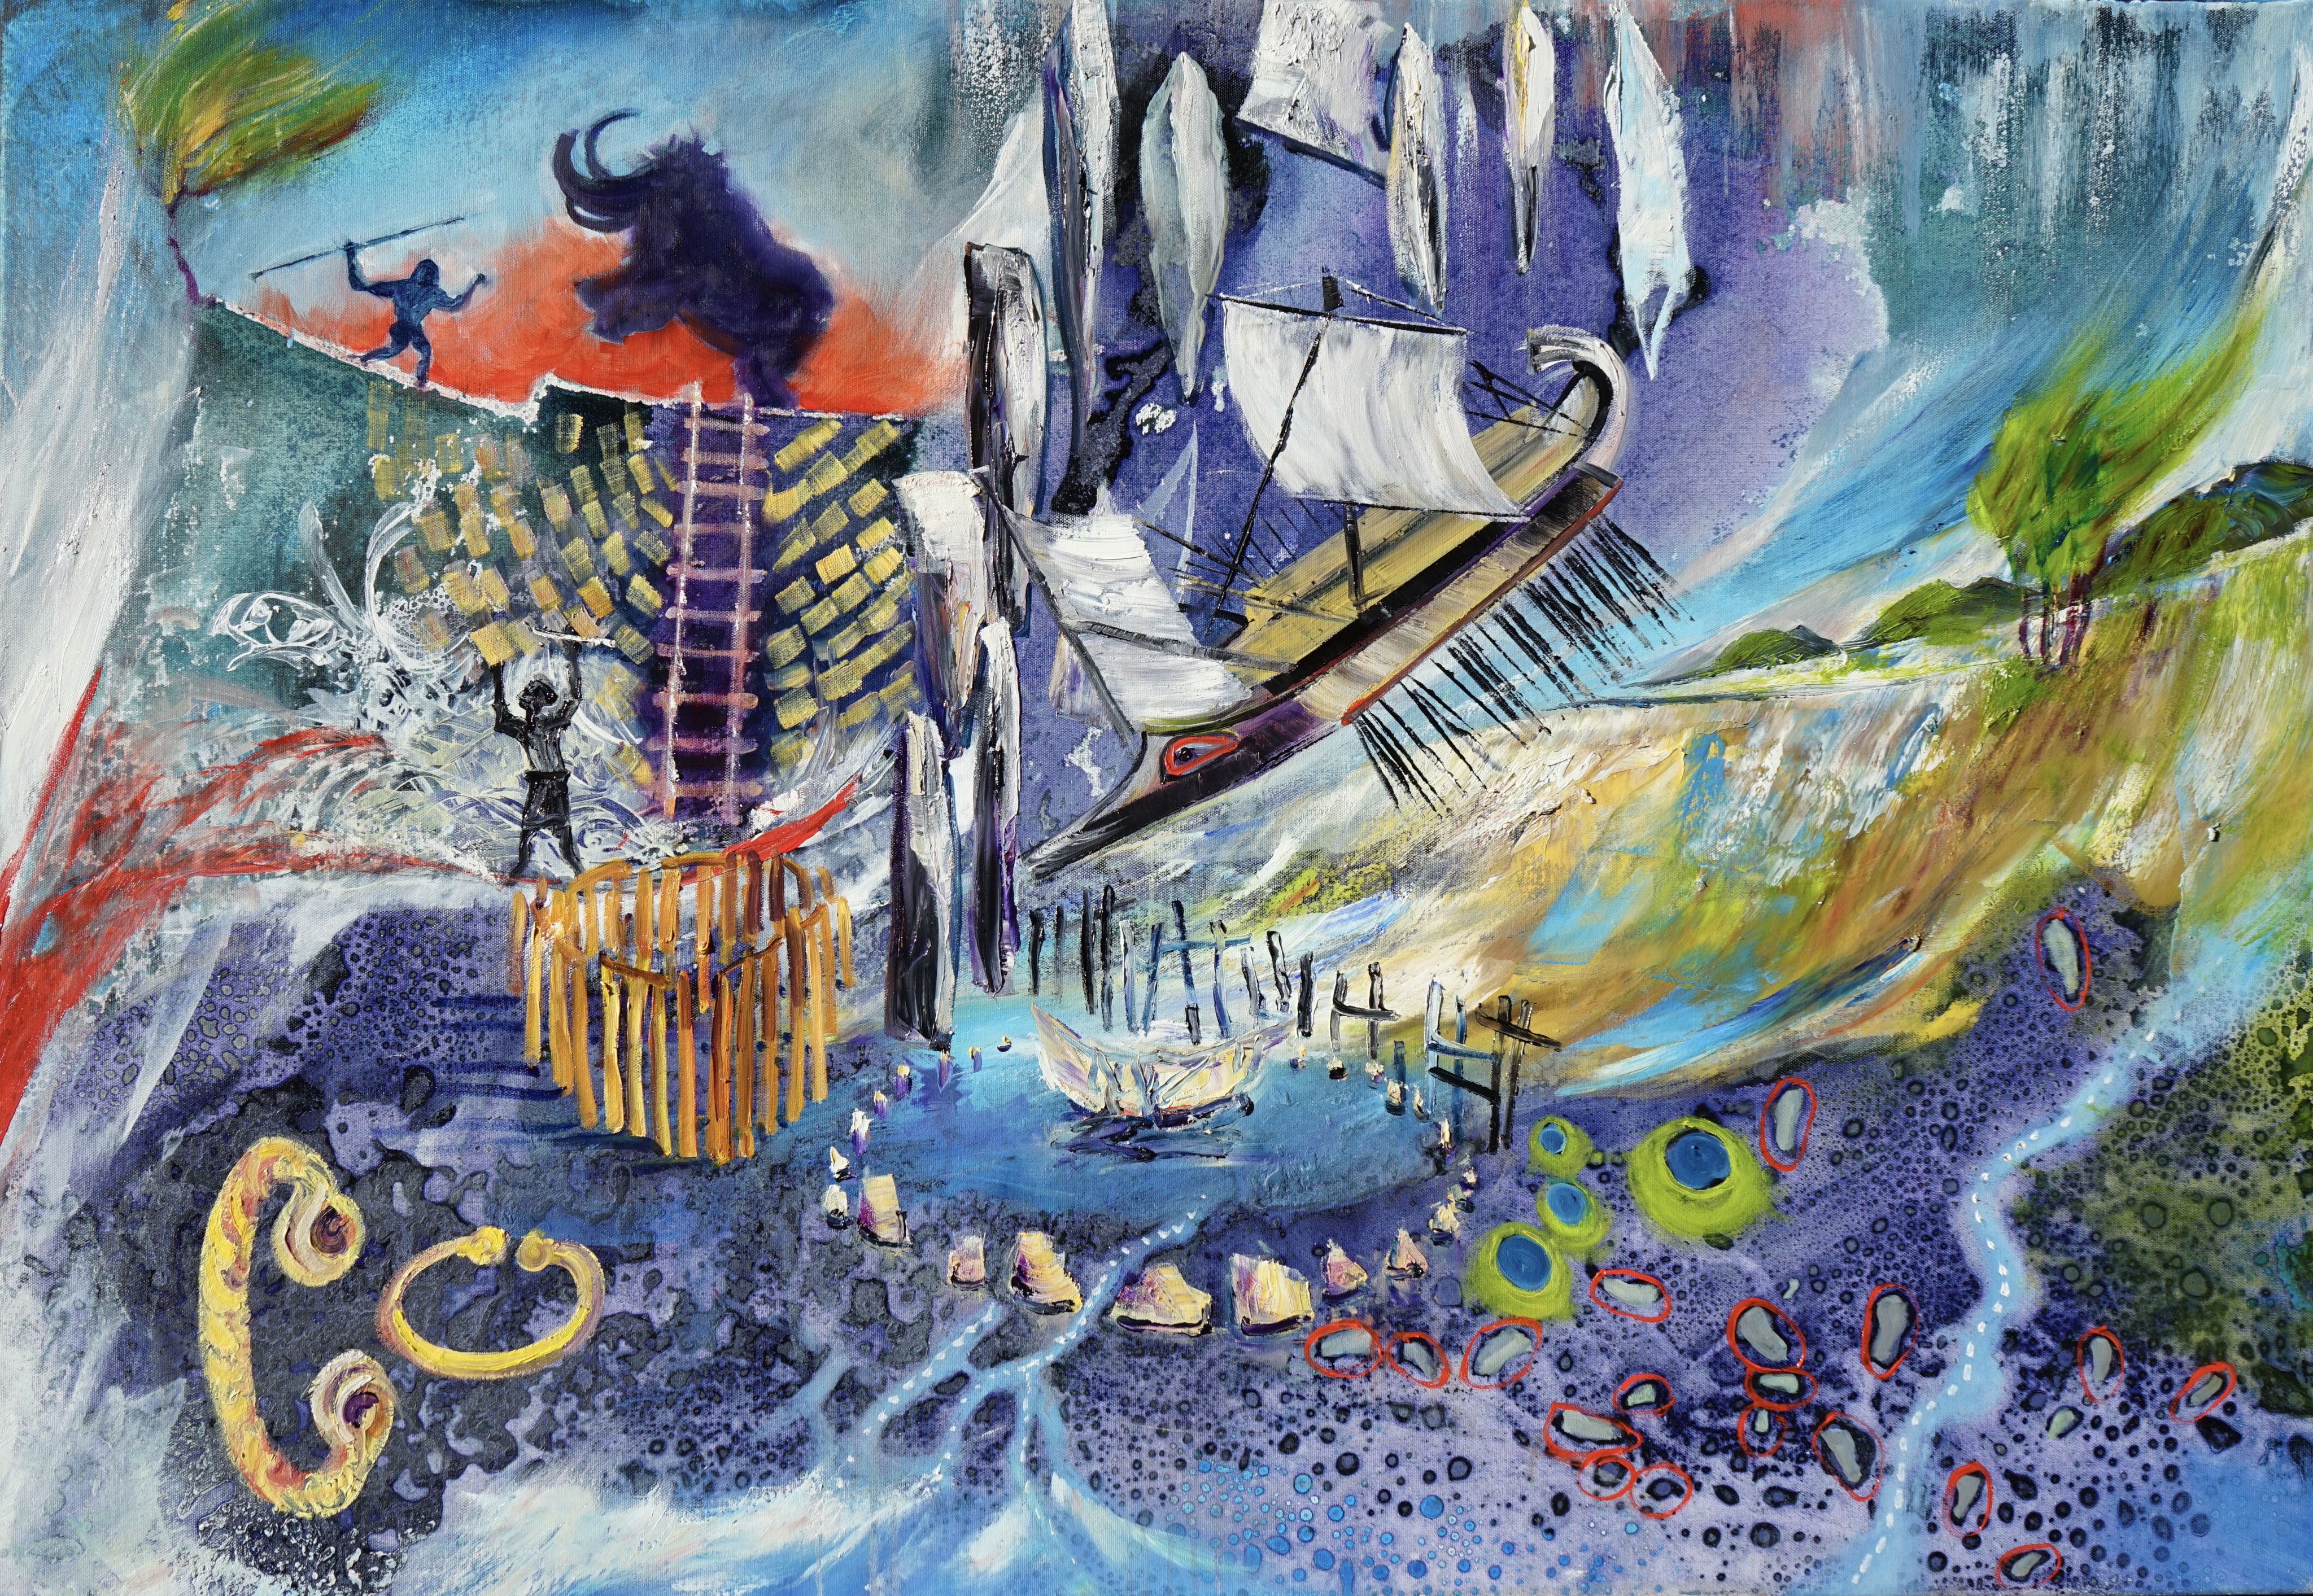
Norfolk on ice and soon after: Images of human life through the ice ages and into the relative calm of the Holocene © Gennadiy Ivanov
Norfolk on ice and soon after: Images of human life through the ice ages and into the relative calm of the Holocene © Gennadiy Ivanov
Cycles of ice ages, all of which had a profound effect on Norfolk, dominated this period, and some of these are seen in this painting. The advances and retreats of the ice are evident in our landscapes today. Our early ancestors arrived in Norfolk 800,000 years ago. They knew the ice. The glacial cycles gave way to the relatively stable climate of the last 12,000 years, the Holocene, which helped humans to harness their imaginations. In Norfolk they built impressive circles, made of timber. They made jewellery. They developed industries. Rising sea levels, as the ice melted, placed Norwich at the head of an estuary, allowing the Romans to boost their presence in the county even more.
Our climate history
501-1400CE

City of stories: This panel shows Norwich during its time as one of the most prosperous cities in Britain © Gennadiy Ivanov
City of stories: This panel shows Norwich during its time as one of the most prosperous cities in Britain © Gennadiy Ivanov
Much of what we know about the climate of this period comes from tree rings and documentary records. The first 600 years saw a relatively benign climate, and these favourable conditions enabled the Vikings to make their forays. By 1000, Norwich had become one of the most prosperous cities in the land, and the building of the Cathedral soon started. A rapid deterioration of climate began around 1150. A growing demand for fuel led to more peat digging – the pits eventually flooding because of rising sea levels and a stormier and wetter climate, giving us today’s Norfolk Broads. The growing inclemency of the climate started to have a big impact on people’s lives, often exacerbating other social and economic factors. Famines made people more susceptible to the Black Death.
1401-1850

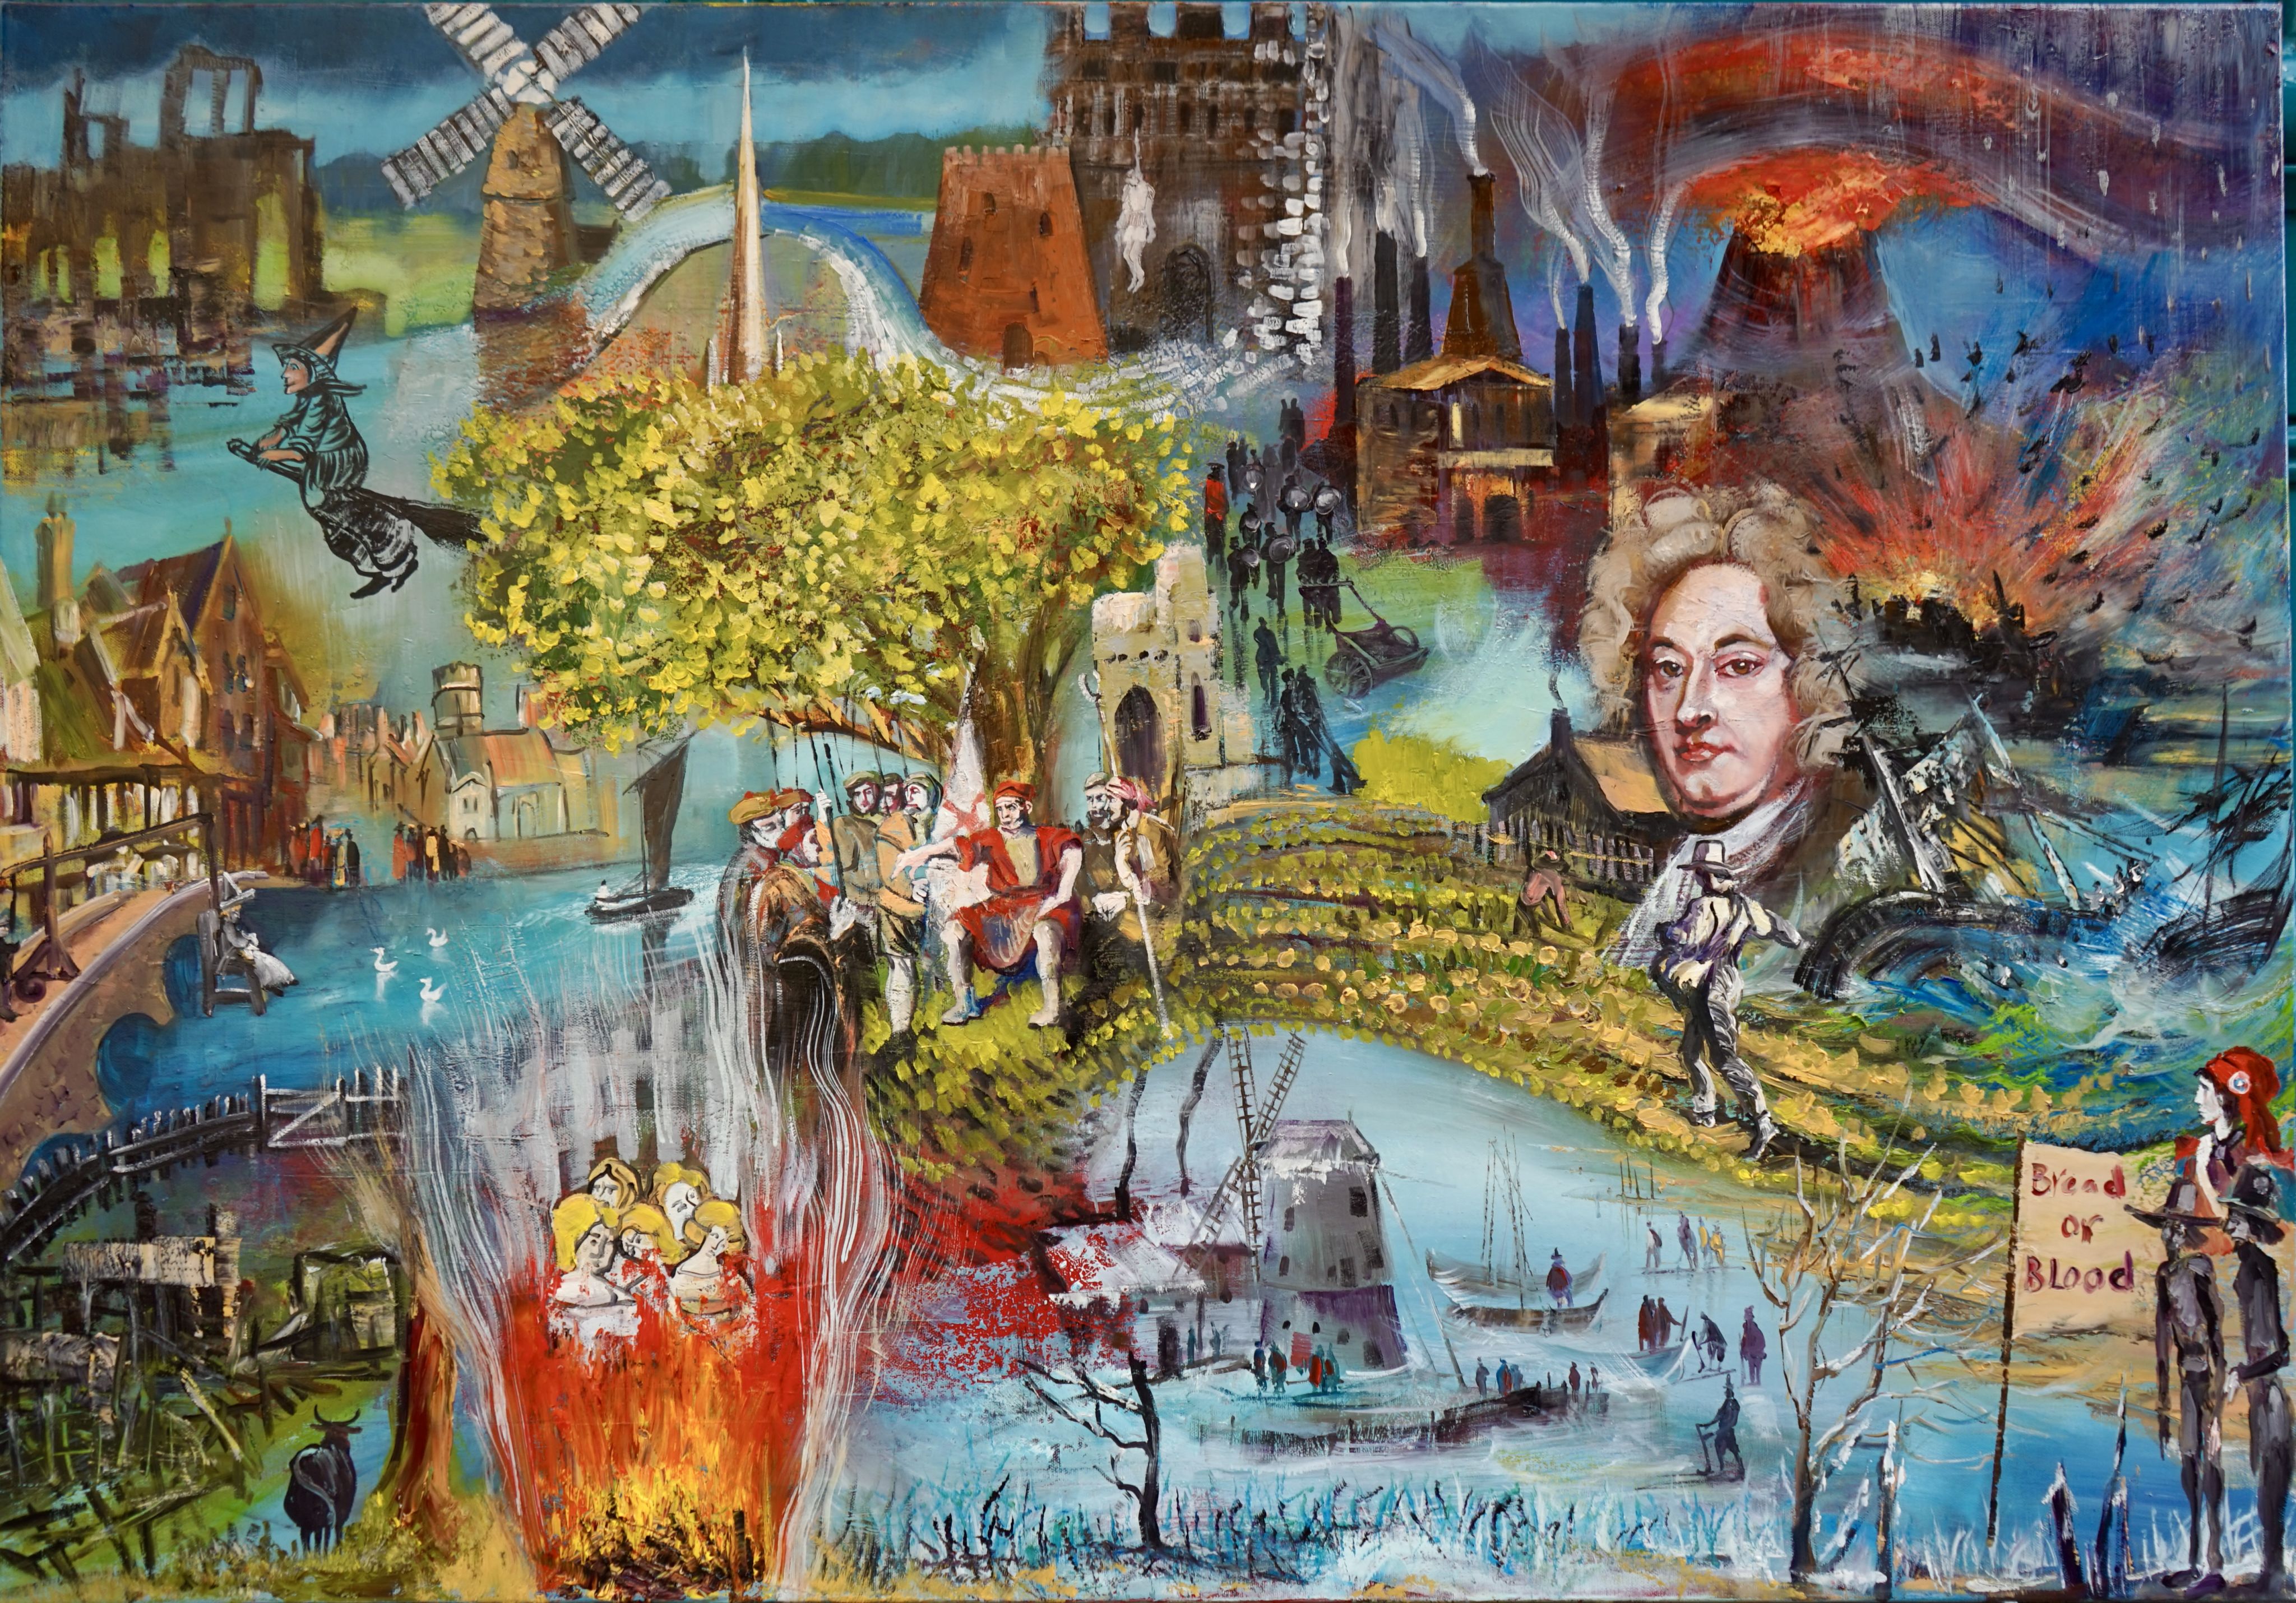
Rebels and revolts: This period was one of unrest and revolution, as seen in this panel showing witch-hunts, Kett's Rebellion and more © Gennadiy Ivanov
Rebels and revolts: This period was one of unrest and revolution, as seen in this panel showing witch-hunts, Kett's Rebellion and more © Gennadiy Ivanov
The climate worsened into “The Little Ice Age”. Norfolk villages were abandoned and shipwrecks were abundant. Bad weather set the preconditions for Kett’s Rebellion in 1549. Scapegoats were sought and "witches”, accused of causing bad weather were persecuted. The political instability of the 1600s, set off a long train of events eventually leading to Norwich gaining its reputation as the Revolutionary City. The Agricultural Revolution, spearheaded by Turnip Townshend, provided greater resilience. But adverse climate impacts continued, contributing to a wave of emigration from Norfolk in the 1830s. While skating became fashionable on the frozen Broads, the chimneys of the Industrial Revolution began spewing out carbon dioxide. The cataclysmic volcanic eruption of Tambora caused the “year with no summer” in 1816, forever linked with Mary Shelley’s creation – Frankenstein.
Our climate present
1851-present

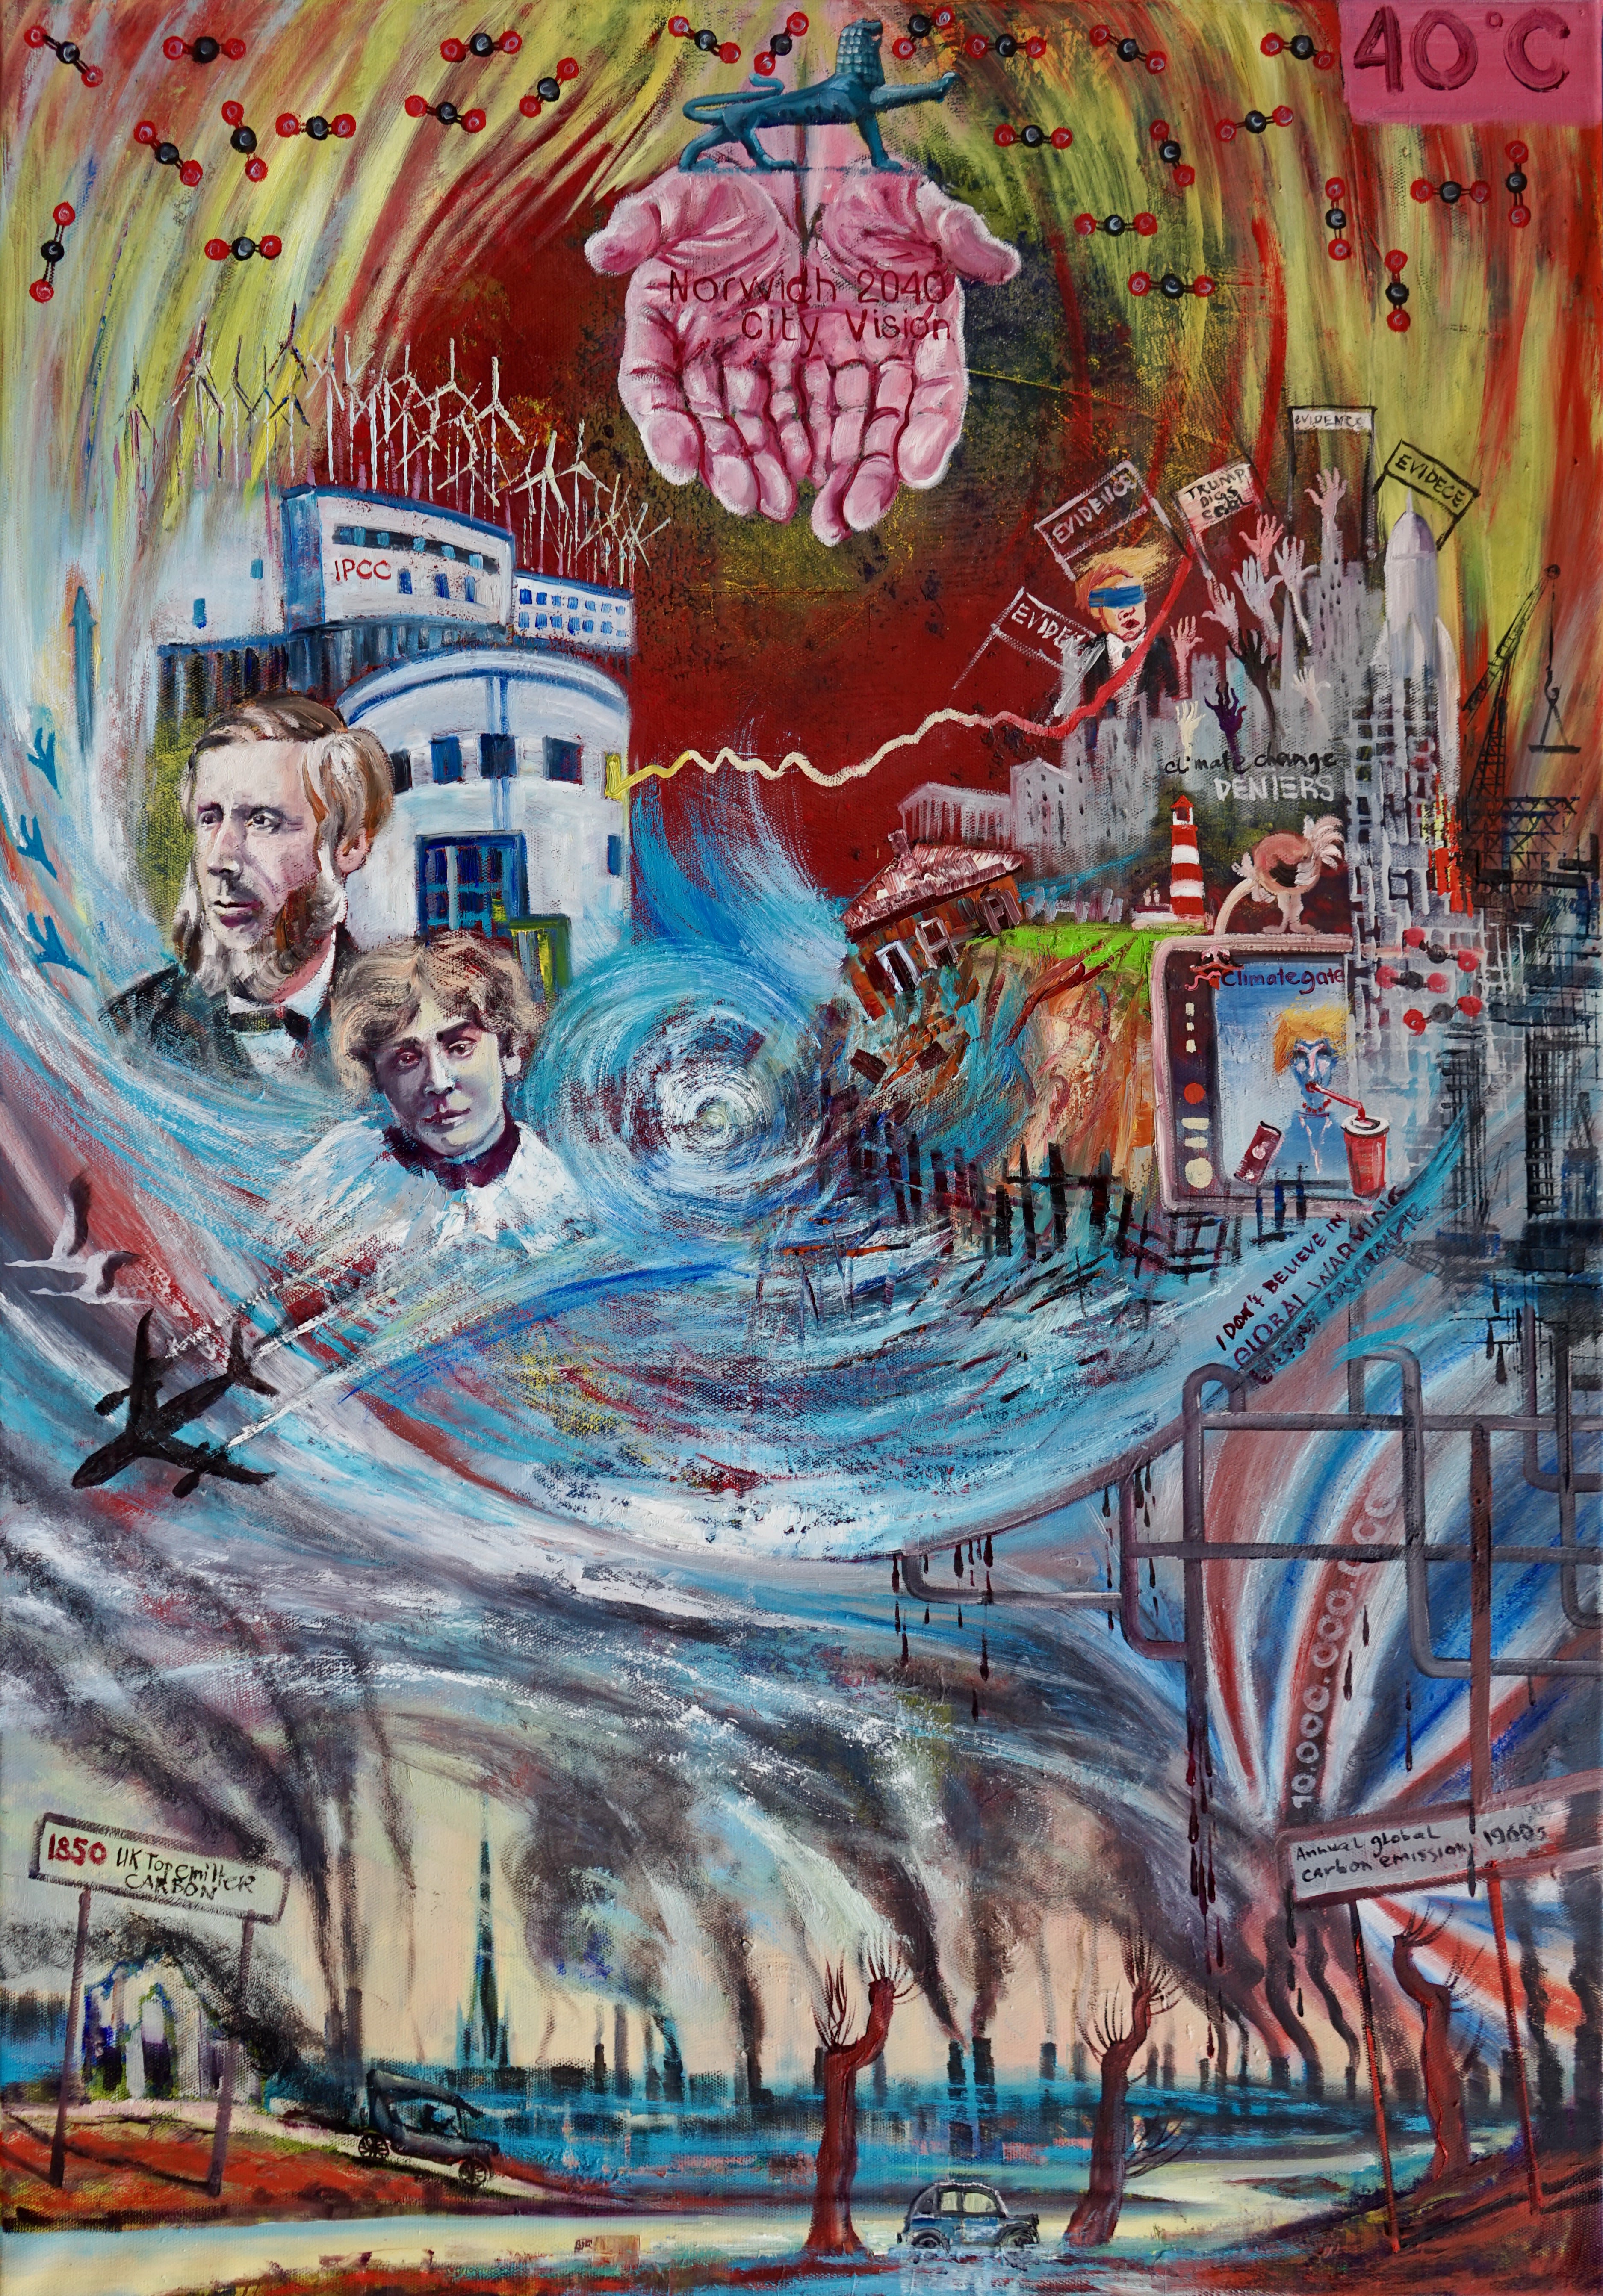
Climate science as we know it: This panel shows the period from when there was a sufficient number of high-quality instrumental records of temperature around the world to track temperature increases in great detail. Climate science grew, as did our emissions of CO2 and the subsequent impacts © Gennadiy Ivanov
Climate science as we know it: This panel shows the period from when there was a sufficient number of high-quality instrumental records of temperature around the world to track temperature increases in great detail. Climate science grew, as did our emissions of CO2 and the subsequent impacts © Gennadiy Ivanov
In 1850 the UK was by far the world’s top emitter of fossil carbon dioxide. In this decade the American scientist Eunice Newton Foote discovered its atmospheric warming effect. She was followed swiftly by the independent work of Irish physicist John Tyndall. By 1870 the UK had emitted 50% of the world’s cumulated emissions. In the 1960s, annual global emissions reached 10 billion tonnes and, by 1999, cumulated emissions topped 1 trillion tonnes.
Norfolk has played important roles in North Sea energy; both from fossil sources and now from renewable sources for the future.
Extreme weather events associated with global warming have hit Norwich and Norfolk. East Anglia saw a record high temperature of 40°C in July 2022, extremely rare in the present climate. If a similar weather pattern to the mural’s projection were to occur, it would bring temperature extremes topping 43°C in 2100 and 46°C in 2200.
It was also during the period shown in this panel that our scientific understanding of climate change became firmly established, and with it, the ability first to predict our future climate and second to determine what actions are necessary to stabilise our climate. CRU was established in 1972 and has spearheaded research into global warming since. Its mission since its founding is to investigate and understand the changing climate. CRU and its partner, the Tyndall Centre for Climate Change Research, continue to shine a scientific light for the future.
Norwich City Council is also shining a light on the future. Addressing climate change is a central pillar of its 2040 vision. It has much to build on. Award-winning energy-efficient buildings are seen at UEA and in the City – in particular in Goldsmith Street. In 2002, UEA, Norwich City Council and other partners launched an innovative community carbon reduction project, which was successful until it was de-railed by the combination of the 2007-8 global financial crisis and the 2009 attack which resulted in Climategate. A lesson which should be well-learned: not prioritising action on climate change now will cost so much more in years to come.
Our climate future: Present-2200
The future is yet to be written. It is for all of us to decide and co-produce. The solutions to climate change we imagine, and what Norwich, Norfolk – and the world – will look like are yet to be painted. Our imaginations will be so great that we will need many canvases for the future.
We are intertwined with our planet. Our natural world nourishes and sustains us and has provided what we needed to evolve. But we have outgrown ourselves. Overshoot Day, the day we have used up the ecological resources that the Earth can regenerate in a year is getting earlier each year. This year it was July 28. For a sustainable future it should be December 31. It once was, over 50 years ago, before our destabilisation of the climate by global warming. Our pursuit of continual growth on a finite planet means we are stealing from our own future. We need to quickly innovate, for better lives without unending growth. To give Earth, and ourselves, time to renew.
The science behind the paintings
Paleoclimate archives
The signature of nature’s heartbeat is all around us. And the Earth has been preserving its rhythm. Every tree outside the tropics lays down an annual ring. Fallen trees preserved in lake beds tell the tale of thousands of years of local climate history in the width of their annual rings and in the composition of their wood.

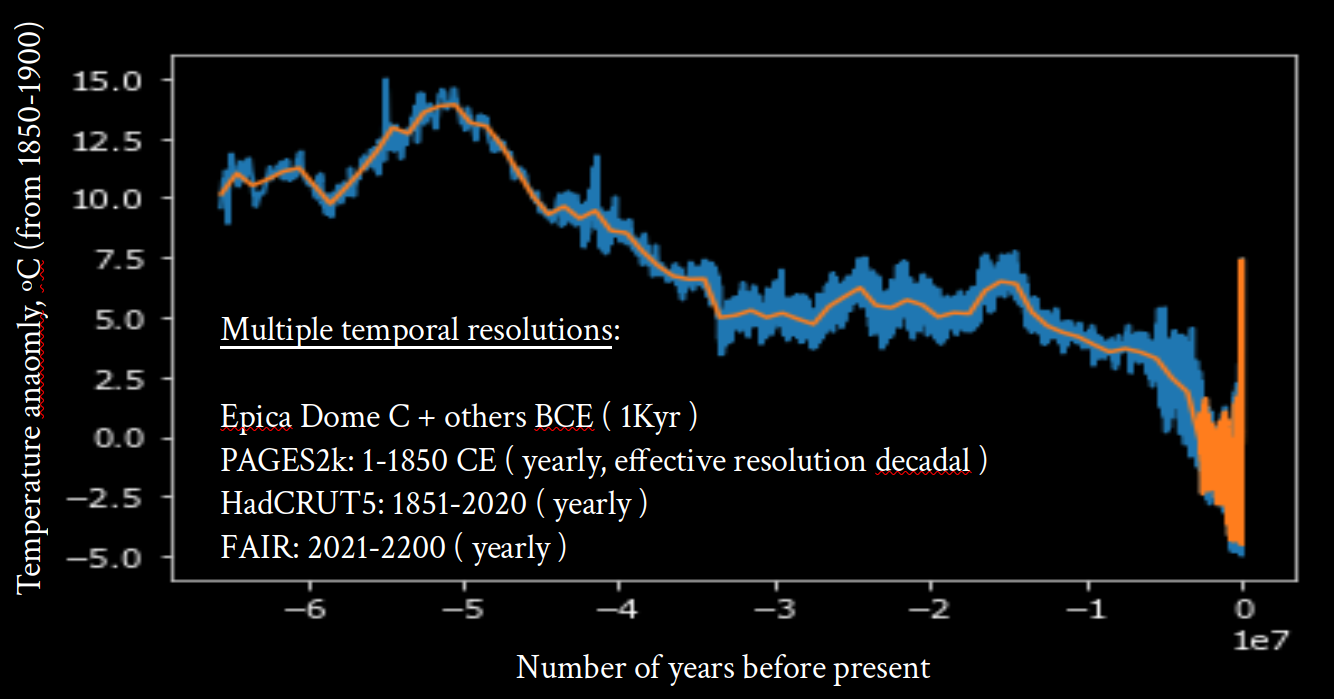
Temperature through time: A graph showing the reconstructed global average surface temperature (blue) and the model fit to the data (orange) used to generate the climate stripes from 65.5 million years ago in the sky of the mural. The data has different time resolution depending on the epoch and the x-axis is in 10’s of millions of years. The orange spike at the right hand side is the 2021-2200 CE forecast from the FAIR climate model for the SSP 3-7.0 high emission projection. In this scenario analogous climates existed over 10 million years ago long before humans. © Michael Taylor & Tim Osborn
Temperature through time: A graph showing the reconstructed global average surface temperature (blue) and the model fit to the data (orange) used to generate the climate stripes from 65.5 million years ago in the sky of the mural. The data has different time resolution depending on the epoch and the x-axis is in 10’s of millions of years. The orange spike at the right hand side is the 2021-2200 CE forecast from the FAIR climate model for the SSP 3-7.0 high emission projection. In this scenario analogous climates existed over 10 million years ago long before humans. © Michael Taylor & Tim Osborn
Every season’s snowfall compacts surface ice, and ice cores bored out of Arctic and Antarctic ice sheets, some kilometres long, contain ancient samples of our atmosphere trapped in their bubbles of air. Alongside trees and ice, scientists have found the history of Earth’s climate in all manner of archives: stalactites, sediments in lakes, and the growth bands of tropical corals to name a few.
Climate reconstructions
Temperatures are reconstructed for the Age of Mammals from many different sources. Oxygen isotopes in the remnants of deep-sea creatures, deposited over time in the sediments of our ocean floors, take us back to the climate at the beginning of the mural. Tree rings take us back a thousand years or so. Thermometer measurements keep track of the Earth’s temperature since industrialisation.

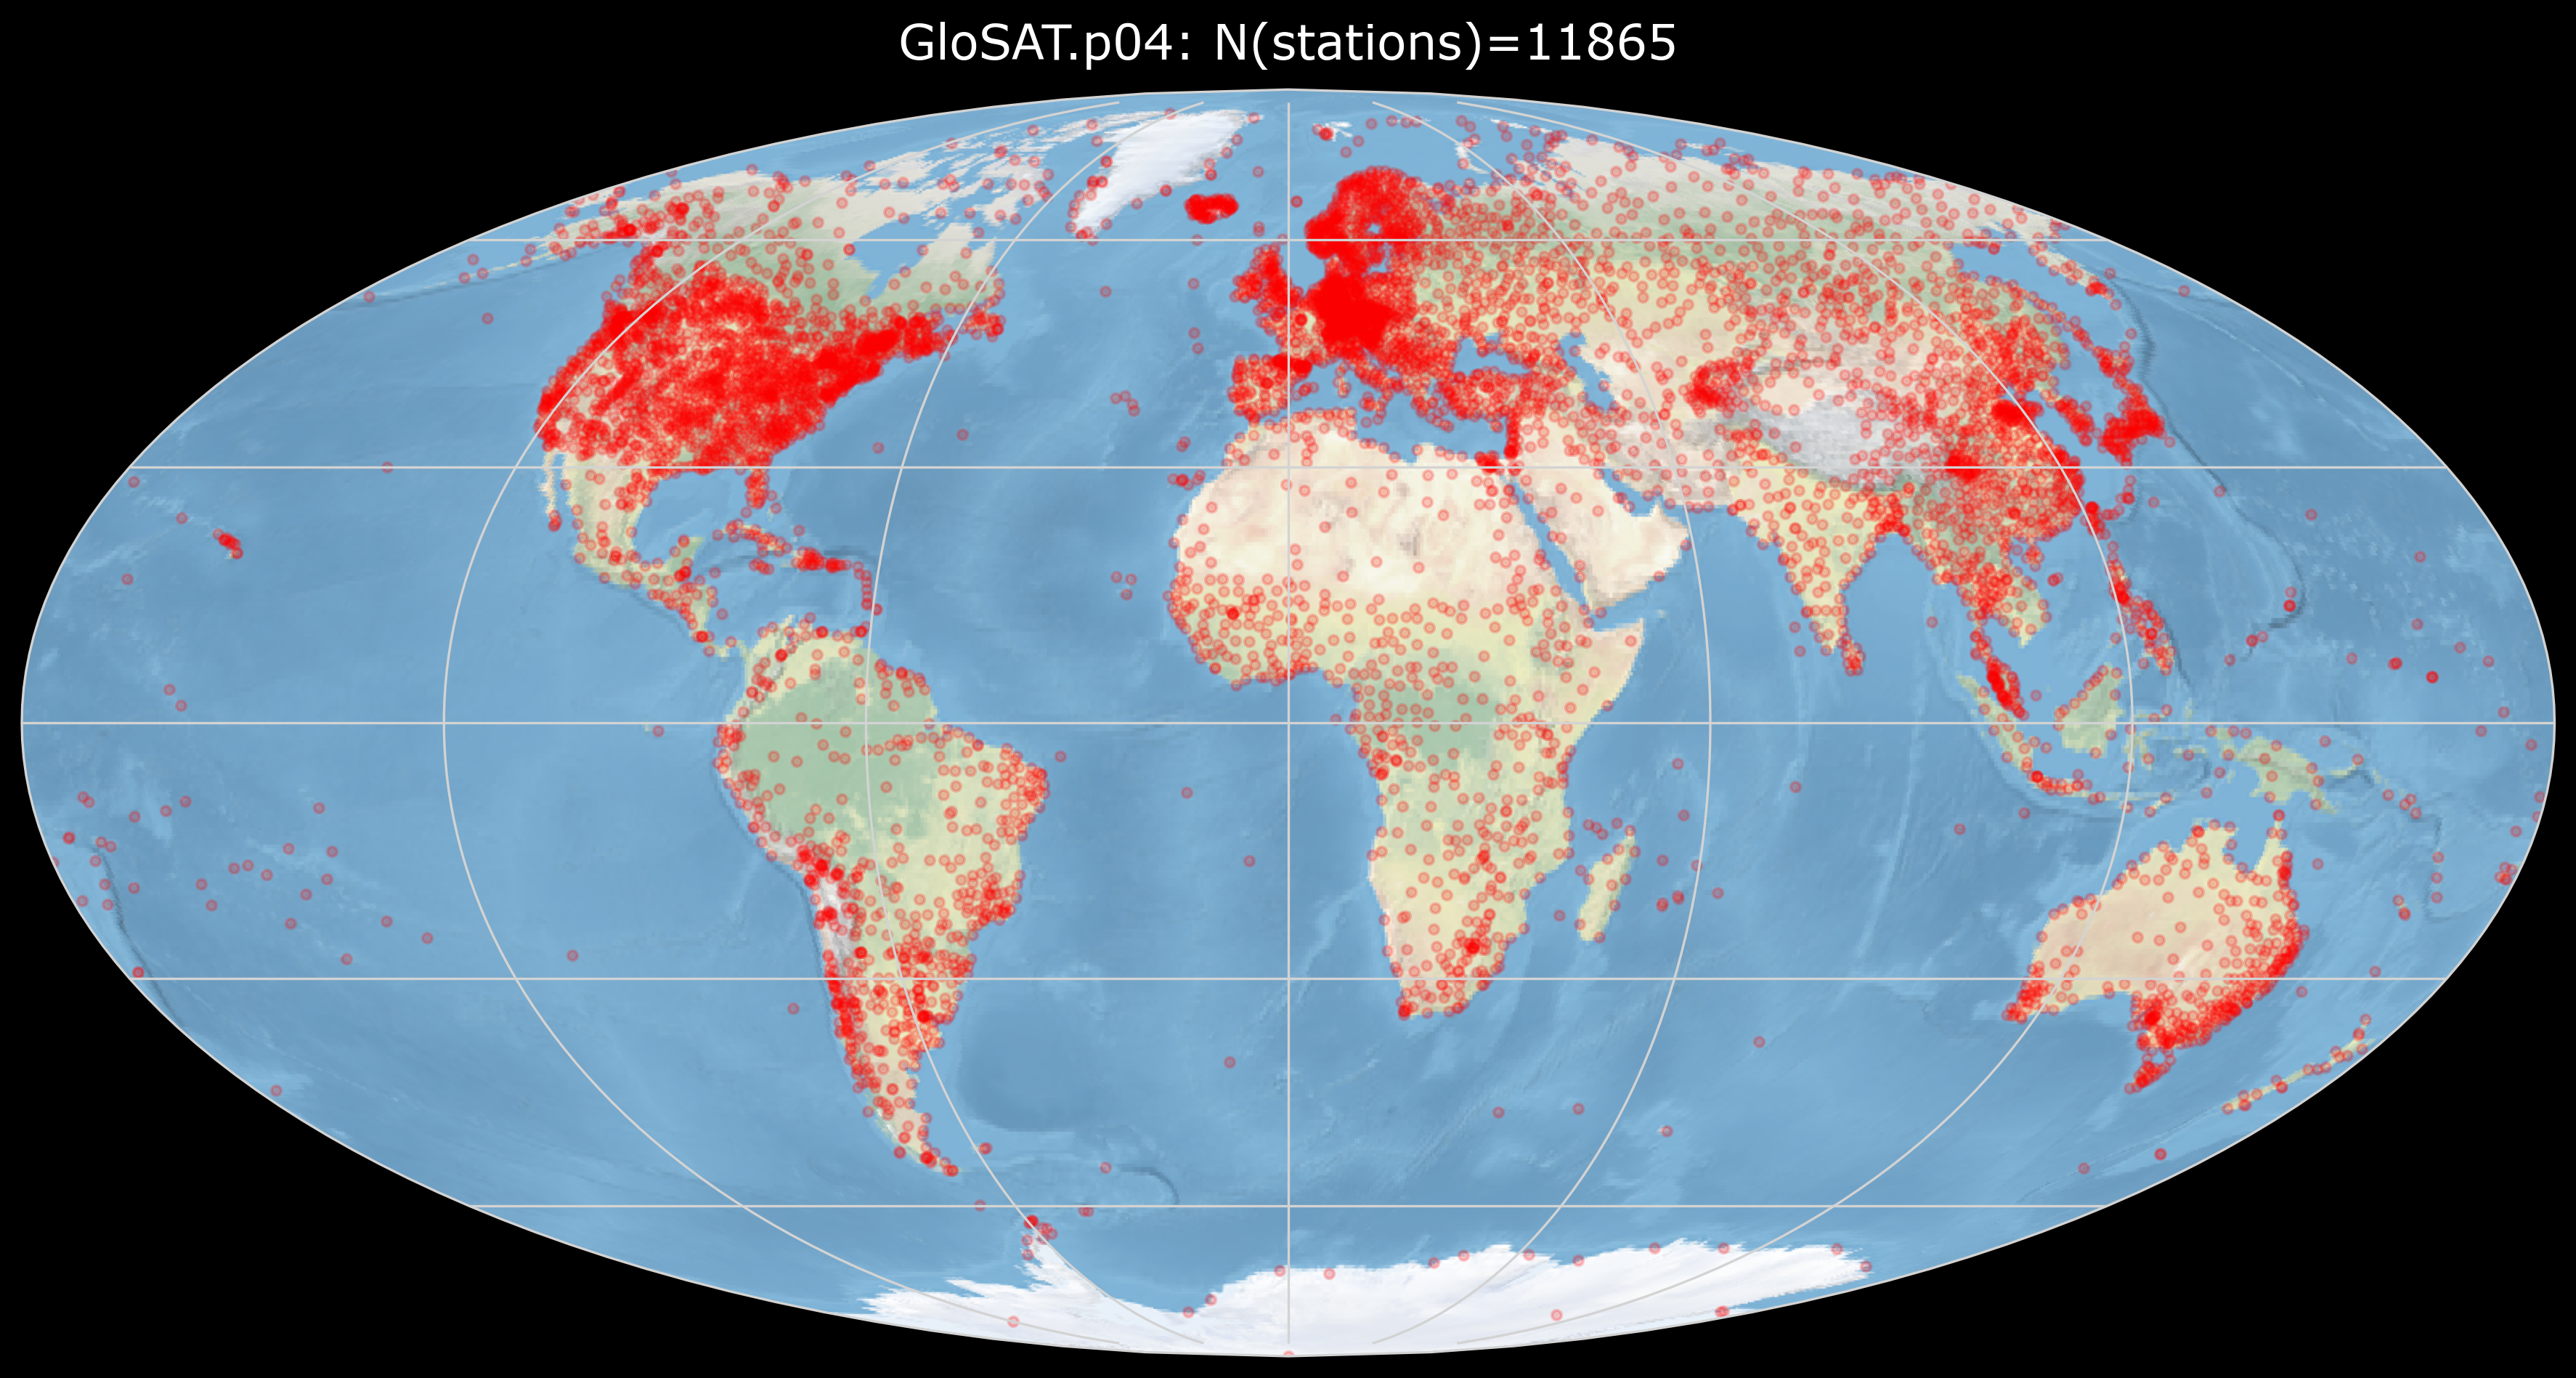
Global measurements: A map of the world showing the location of weather stations that provide the land surface temperature measurements used by the GloSAT project to calculate the global average during the Industrial era. © Michael Taylor & Tim Osborn
Global measurements: A map of the world showing the location of weather stations that provide the land surface temperature measurements used by the GloSAT project to calculate the global average during the Industrial era. © Michael Taylor & Tim Osborn
Each source has its own time interval between measurements. The oldest reconstructions measure the temperature every thousand years. Tree rings provide a record for each individual year. Modern automatic weather stations, seen on the map of Glosat stations above, record the temperature every minute.
The global temperature record
The earliest thermometer measurements in CRU’s archives date from 1658. Our ancestors recorded the weather with diligence and precision across the varied and extreme climates of the world. We currently have monthly average temperatures from 11,865 weather stations all over the world’s surface, providing data even in some of the world’s most inhospitable places from the deserts to the poles.
Seafarers have recorded the temperature of the oceans for 200 years in their ship’s logs. Arrays of drifting buoys now record the sea’s temperature every hour of the day. CRU's scientific research is represented directly within the artwork.

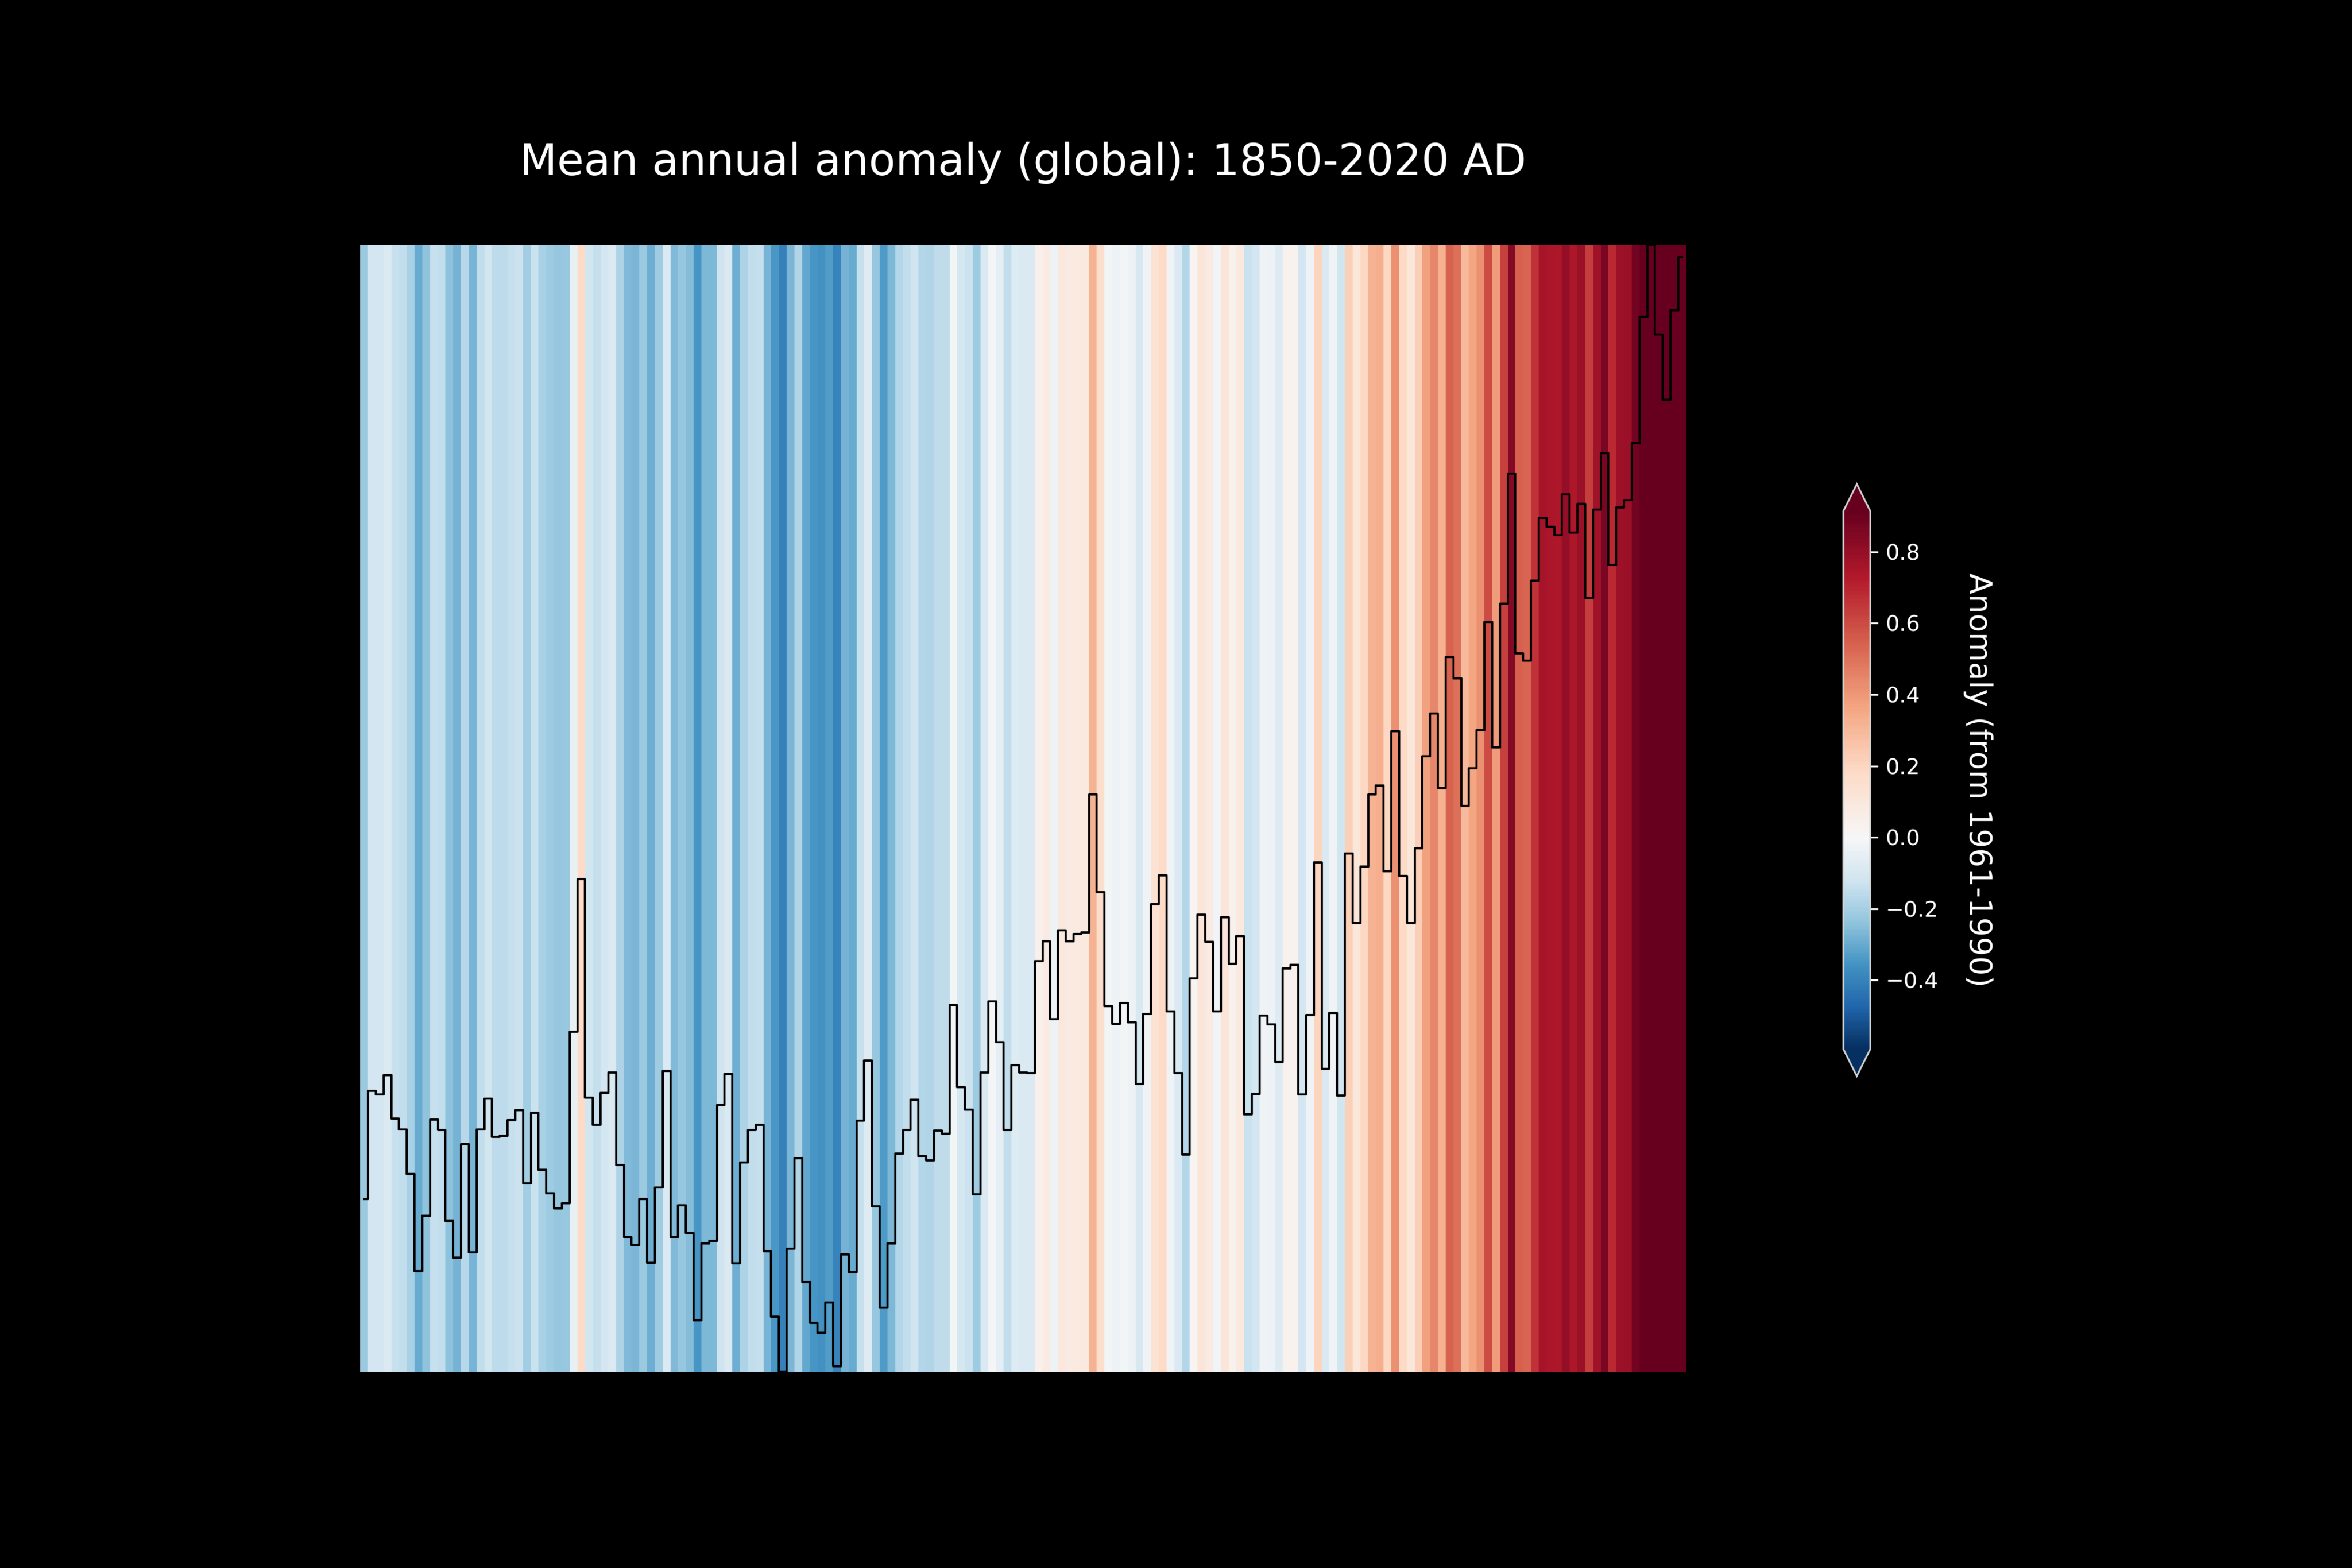
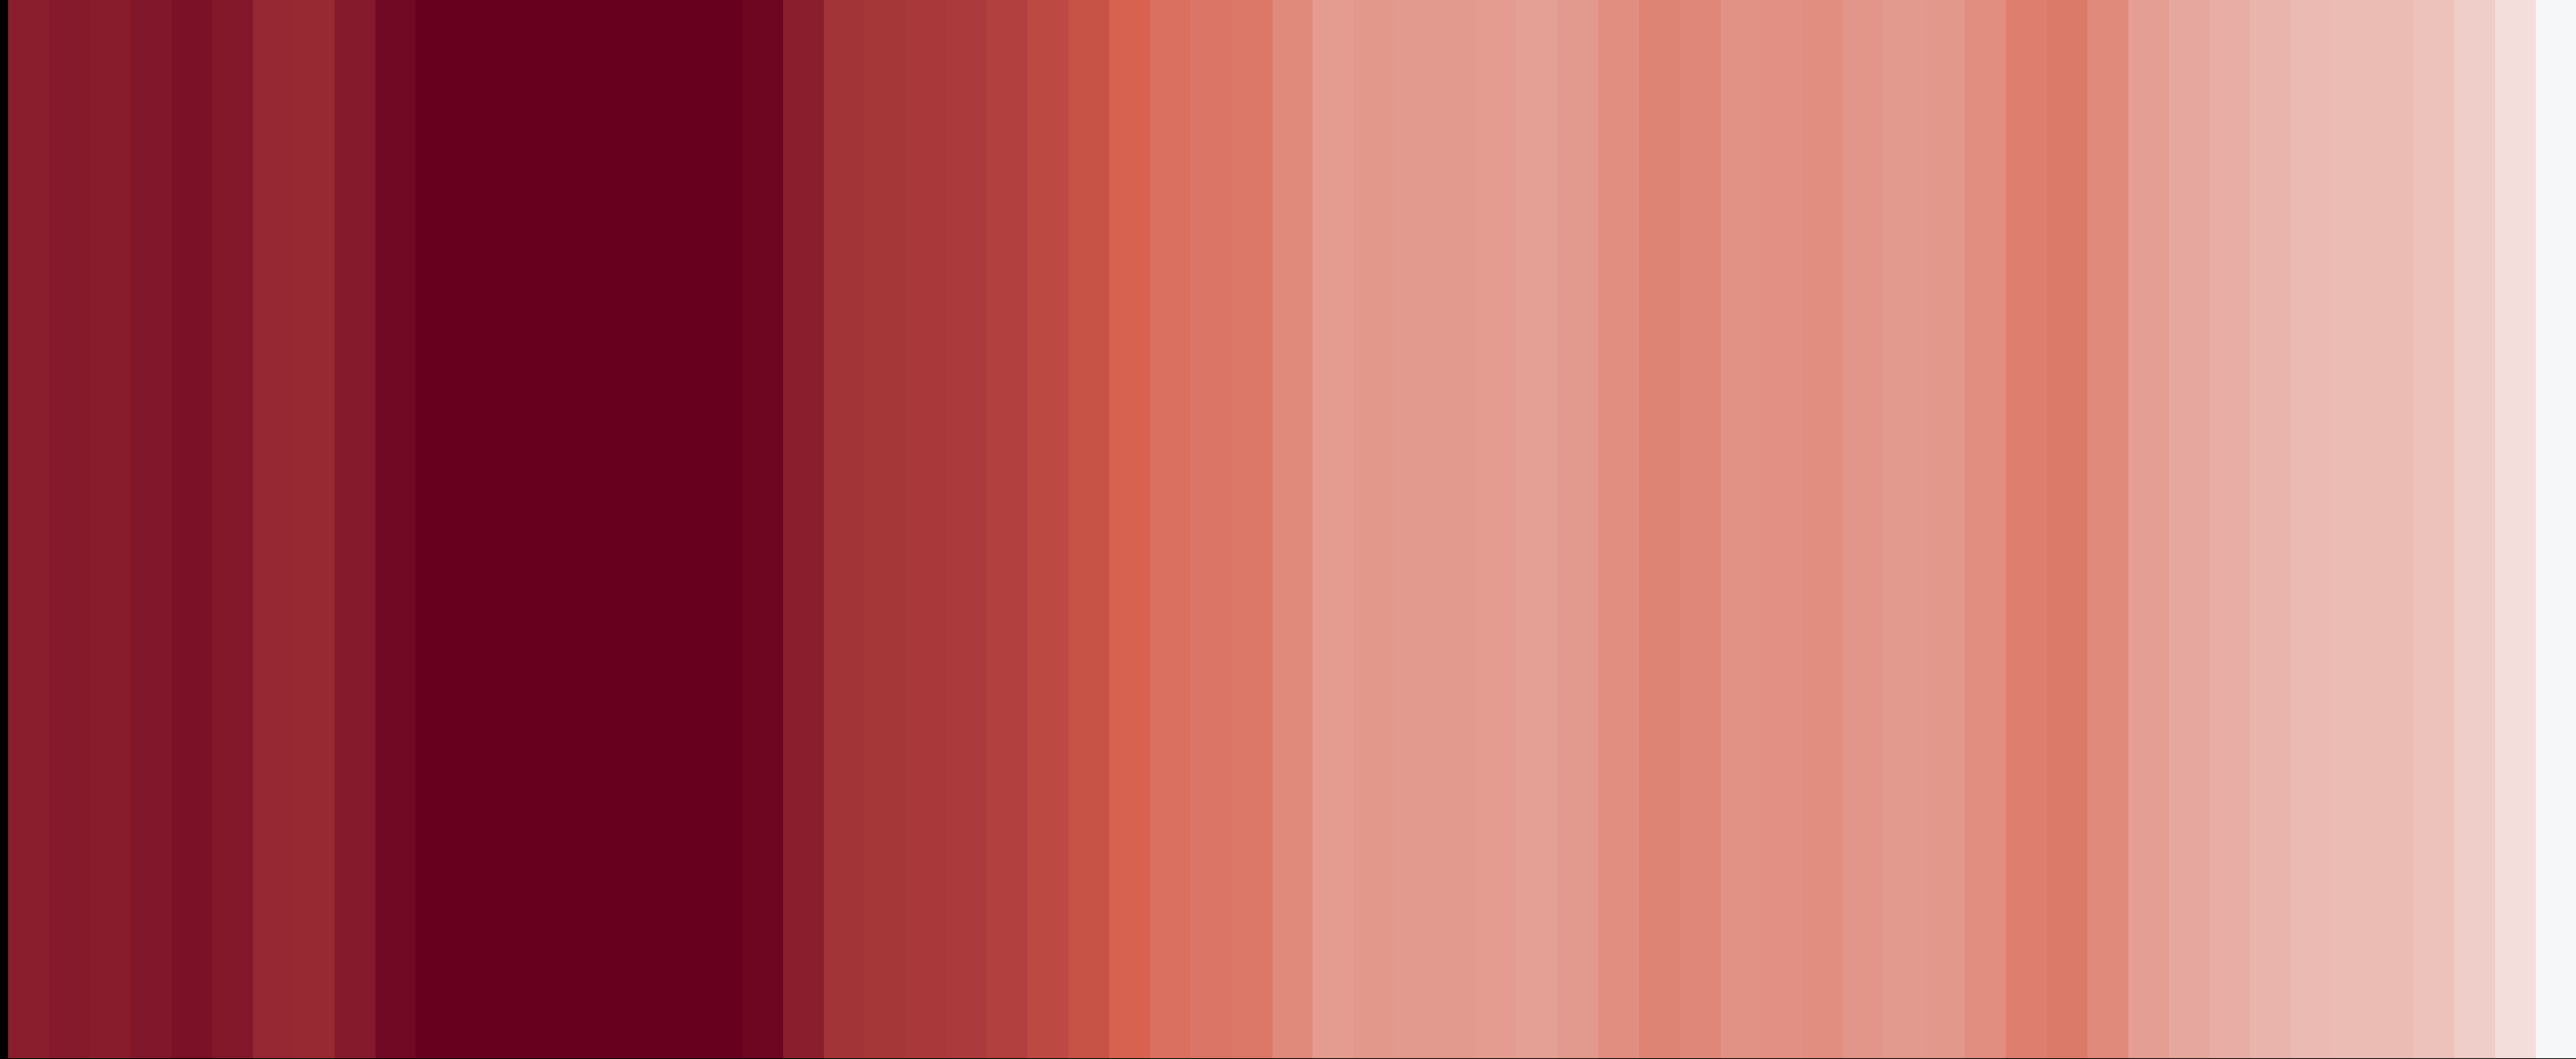
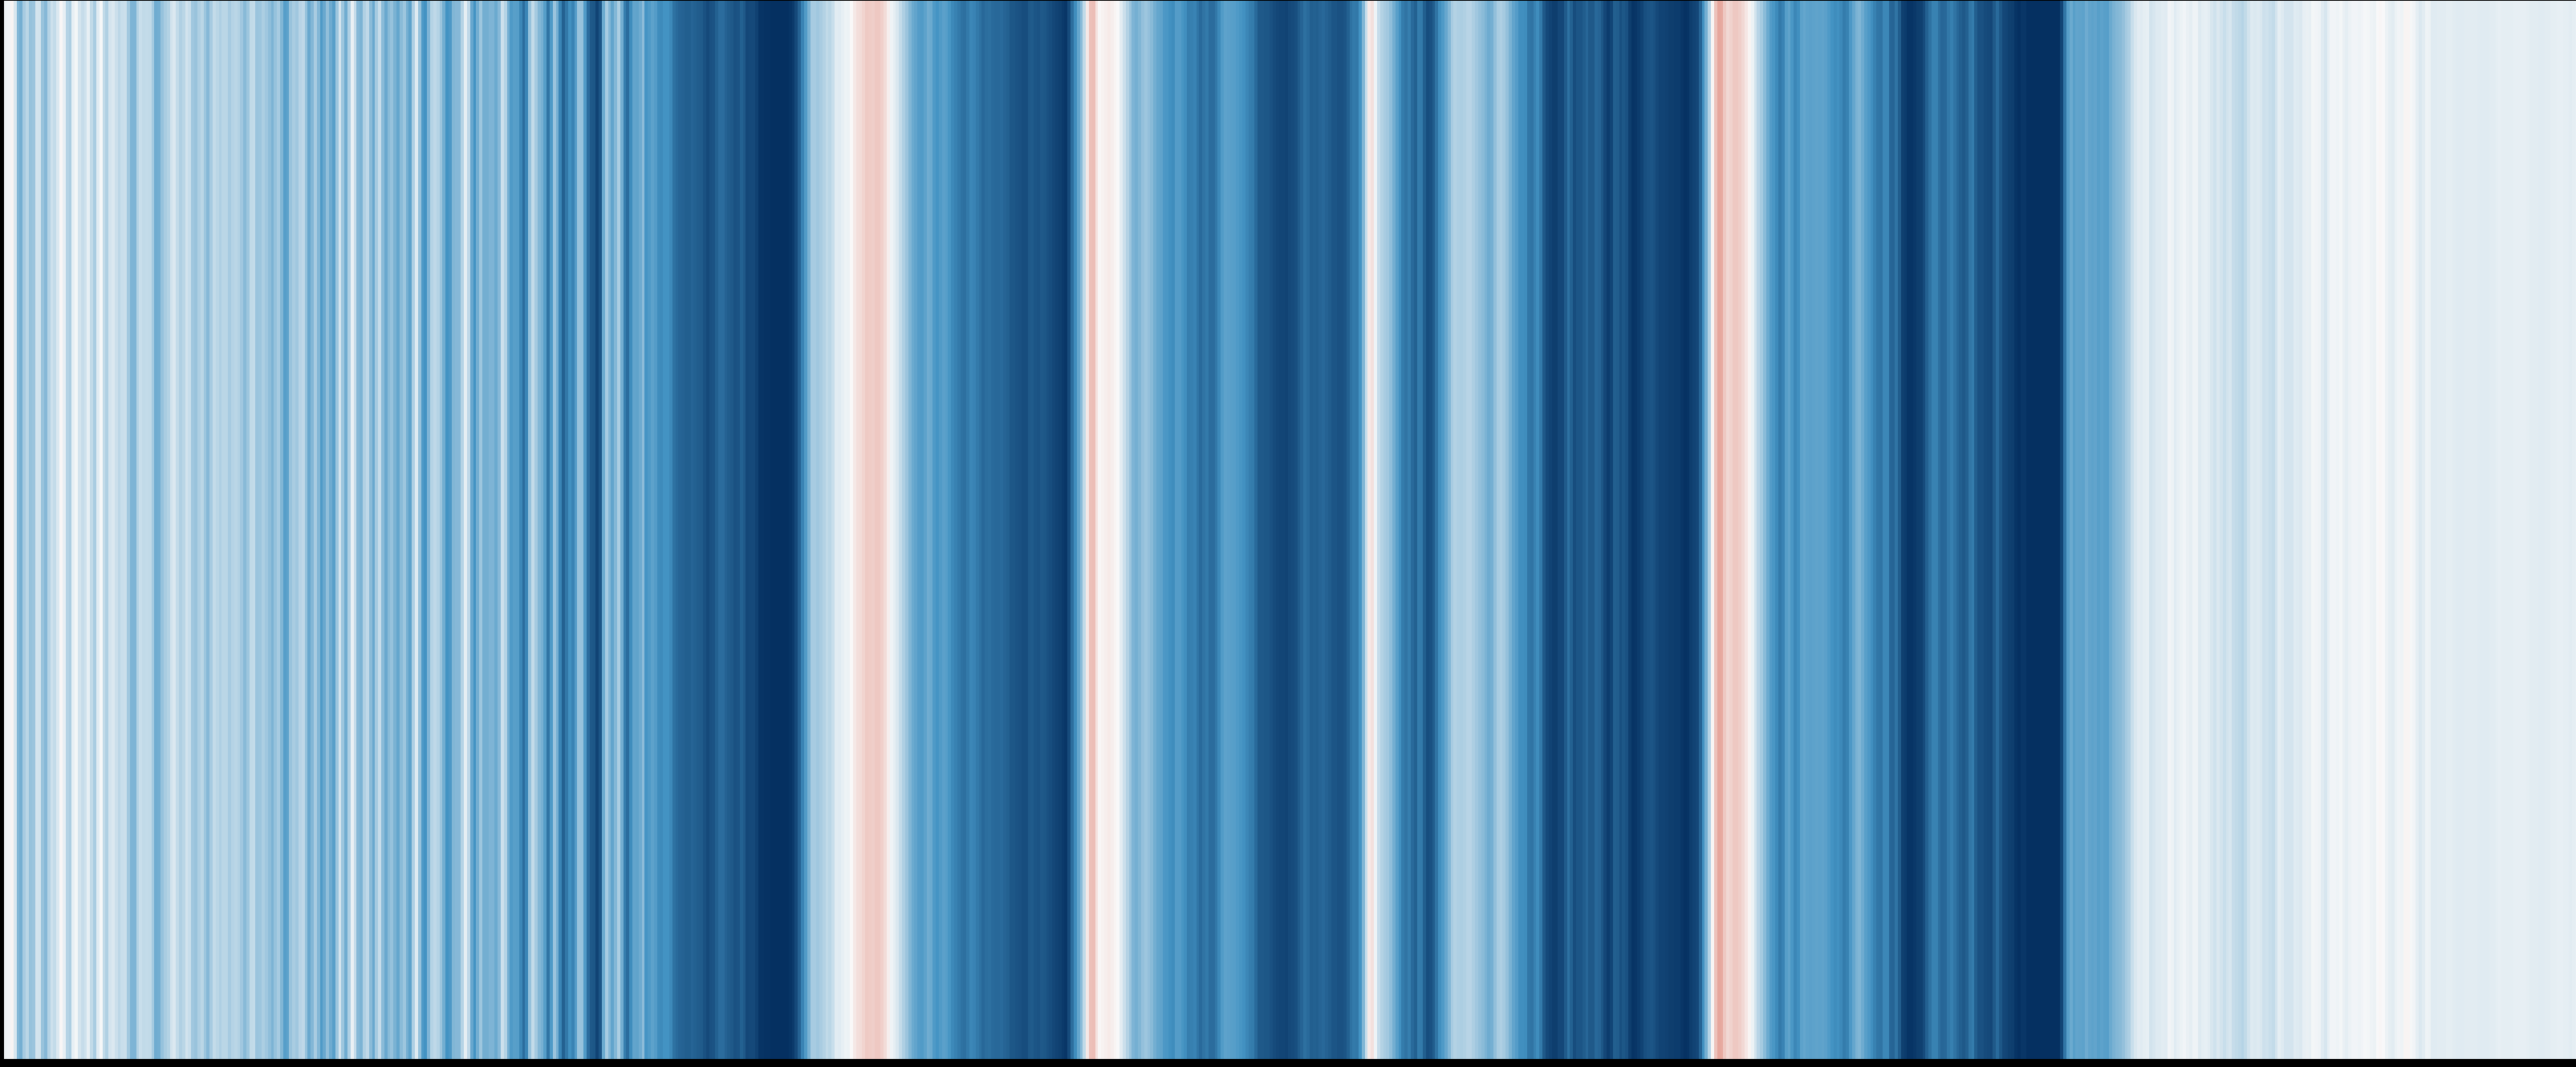
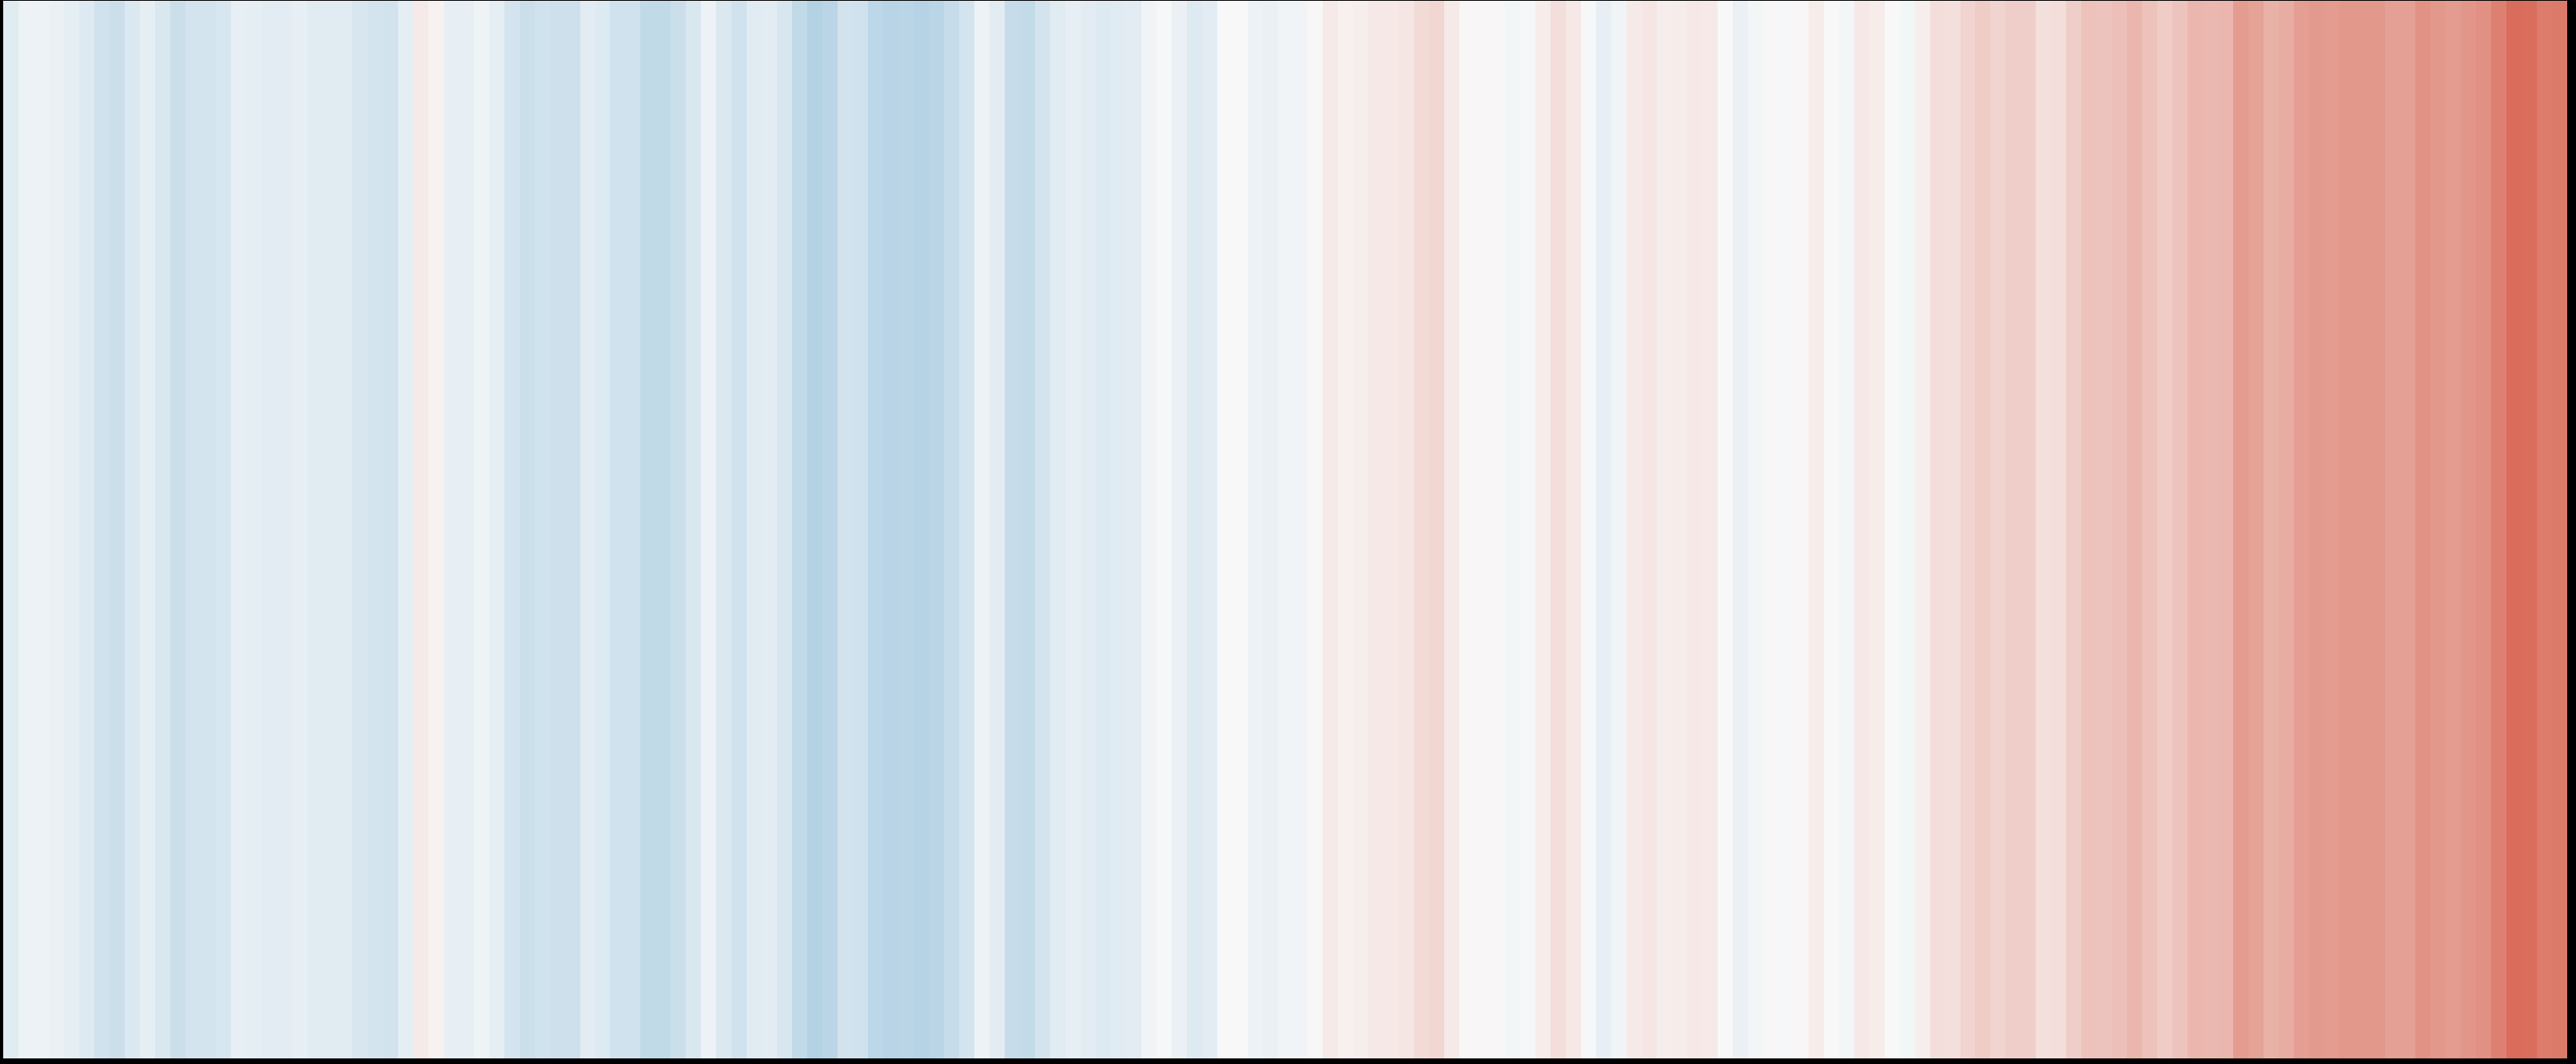
Stripes in the sky: Global temperature departures from the average during a 30-year climatological reference period are mapped onto a blue-white-red colourmap to create warming stripes with bluer stripes being cooler and redder stripes warmer than the average. Climate stripes dating back to 66 million years ago and projected out to the year 2200, were calculated relative to the pre-industrial average 1851-1990 and used to form the backdrop to A Climate Mural for our Times. © Michael Taylor & Tim Osborn
Stripes in the sky: Global temperature departures from the average during a 30-year climatological reference period are mapped onto a blue-white-red colourmap to create warming stripes with bluer stripes being cooler and redder stripes warmer than the average. Climate stripes dating back to 66 million years ago and projected out to the year 2200, were calculated relative to the pre-industrial average 1851-1990 and used to form the backdrop to A Climate Mural for our Times. © Michael Taylor & Tim Osborn
The sky of the mural depicts climate history (and possible climate futures) in the form of Professor Ed Hawkins’ climate stripes. The sky in the panel covering the period 1850-2020 is a direct depiction of the global surface temperature record that CRU develops with the UK Met Office. The predictions in the panel for the future are also influenced by this essential climate record, selecting only those climate models that can match the amount of historical warming that we have observed.
The future of climate models
The most complex computer models of the Earth’s climate system can provide the detail needed at the city level to plan life in a metropolis, but they are slow to run on the global scale. For the mural, we turned to the Finite Amplitude Impulse Response (FaIR) climate model which is simpler but still capable of capturing the links between our emissions of greenhouse gases and the rise in global temperature.
But what of these greenhouse gas emissions in the future? It is up to us to choose our pathway. Possible pathways are intertwined with how we generate and use the energy that supports our society and its economy. What type of technology? How much do we value the natural world? How do we alleviate poverty while providing an environment which is safe for all?
We illustrate these possible futures with two Shared Socioeconomic Pathways (SSPs). A high-emission future (SSP3-7.0) where we continue to dump carbon dioxide in the atmosphere into the next Century and beyond. Or a more benign future (SSP1-2.6) with emissions reduced to net zero and a higher chance of meeting the goals of the Paris Agreement and stabilising climate change soon after 2050.


Connections: Making the mural possible

Global Water Futures
Global Water Futures
The Transitions Art-Science Project and Global Water Futures
John Pomeroy spent two years at UEA in the 1980s, working with Trevor Davies, and they have collaborated ever since. John is now Director of the international Global Water Futures (GWF) research programme which is based at the University of Saskatchewan in Canada. It is the largest university-based freshwater research programme in the world, with a focus on the prediction and management of freshwater supply and quality as the climate undergoes rapid change.
Some of the largest and most rapid climate changes in the world have been seen in the cold regions of Canada, with devastating impacts in that country. There are also “downstream” impacts; for example, the melting of Canadian ice contributes to rising sea levels off Norfolk. When Trevor and Gennadiy approached John with their idea of an art-science Transitions project, he immediately saw the promise in portraying these changes and impacts in art, informed by science, and accompanied by accessible scientific descriptions.
He was able to support Transitions within his scientific outreach programme, whereupon Gennadiy’s art became an important part of GWF’s scientific communication. Transitions played a role important part in the Canadian Government’s decision to set up a new National Water Agency and has led to art-science collaborations with UNESCO.


The Climatic Research Unit
The Climatic Research Unit
Climatic Research Unit and GloSAT
CRU’s contribution to this project was supported by the UK’s Natural Environment Research Council via the GloSAT project. Together with the UK Met Office, CRU has tracked the course of global temperatures during the Industrial Era based on direct climate observations.
CRU has undertaken novel work to extend this both backwards and forwards in time by bringing together the palaeoclimate record and future climate projections over the period spanned by the mural. The record provides a central feature of the mural – the sky. Each stripe shows the temperature relative to the pre-industrial climatological baseline average during 1850-1900. Timescales and colour ranges of the climate stripes vary across the 6 panels of the mural from millions, to thousands, to yearly intervals, to accommodate the increasingly detailed information available as we move forward in time.
About the artist
Gennadiy Ivanov has lived and painted in Norwich for 17 years. He gained an MA at Norwich University of the Arts. He is a founding member of the Transitions art-science project, along with scientists Trevor Davies and John Pomeroy. His first climate-related paintings were of the Norfolk coastline. During an artist-in-residency with Global Water Futures, he joined scientists on field research programmes in the Canadian Rockies and the Arctic.
He has a remarkable range of styles and techniques, and perfected the skill of rapidly producing field paintings in the severest of conditions in the remotest of places. He used these field paintings, photographs, memories, and imagination to create large oil paintings all the time in conversation with the scientists. His unique paintings, together with scientific captions, have been exhibited many times in the UK and Canada. They were shown at COP 26 in Glasgow, and at the UN General Assembly in New York. He has become a foremost exponent of climate art, all the time rooted in the latest science.
Because of the scope and overwhelming significance of climate change, it is important to reach people emotionally and intellectually; the problem is so big and so profound. This collaboration with CRU over a vast mural installed at the heart of City Hall, informed by CRU’s science, has given full rein to his imagination and allowed him to deepen the way he works with scientists. Scientific numbers and graphs, and impacts on society, are turned into powerful visual messages.
With thanks to Gennadiy Ivanov (artist), John Pomeroy (University of Saskatchewan), Trevor Davies (UEA), Tim Osborn (UEA), Michael Taylor (UEA, supported by NERC GloSAT), Alan Waters (Norwich City Council)
With acknowledgements to: Ed Hawkins (University of Reading) and Julian Andrews (UEA)

